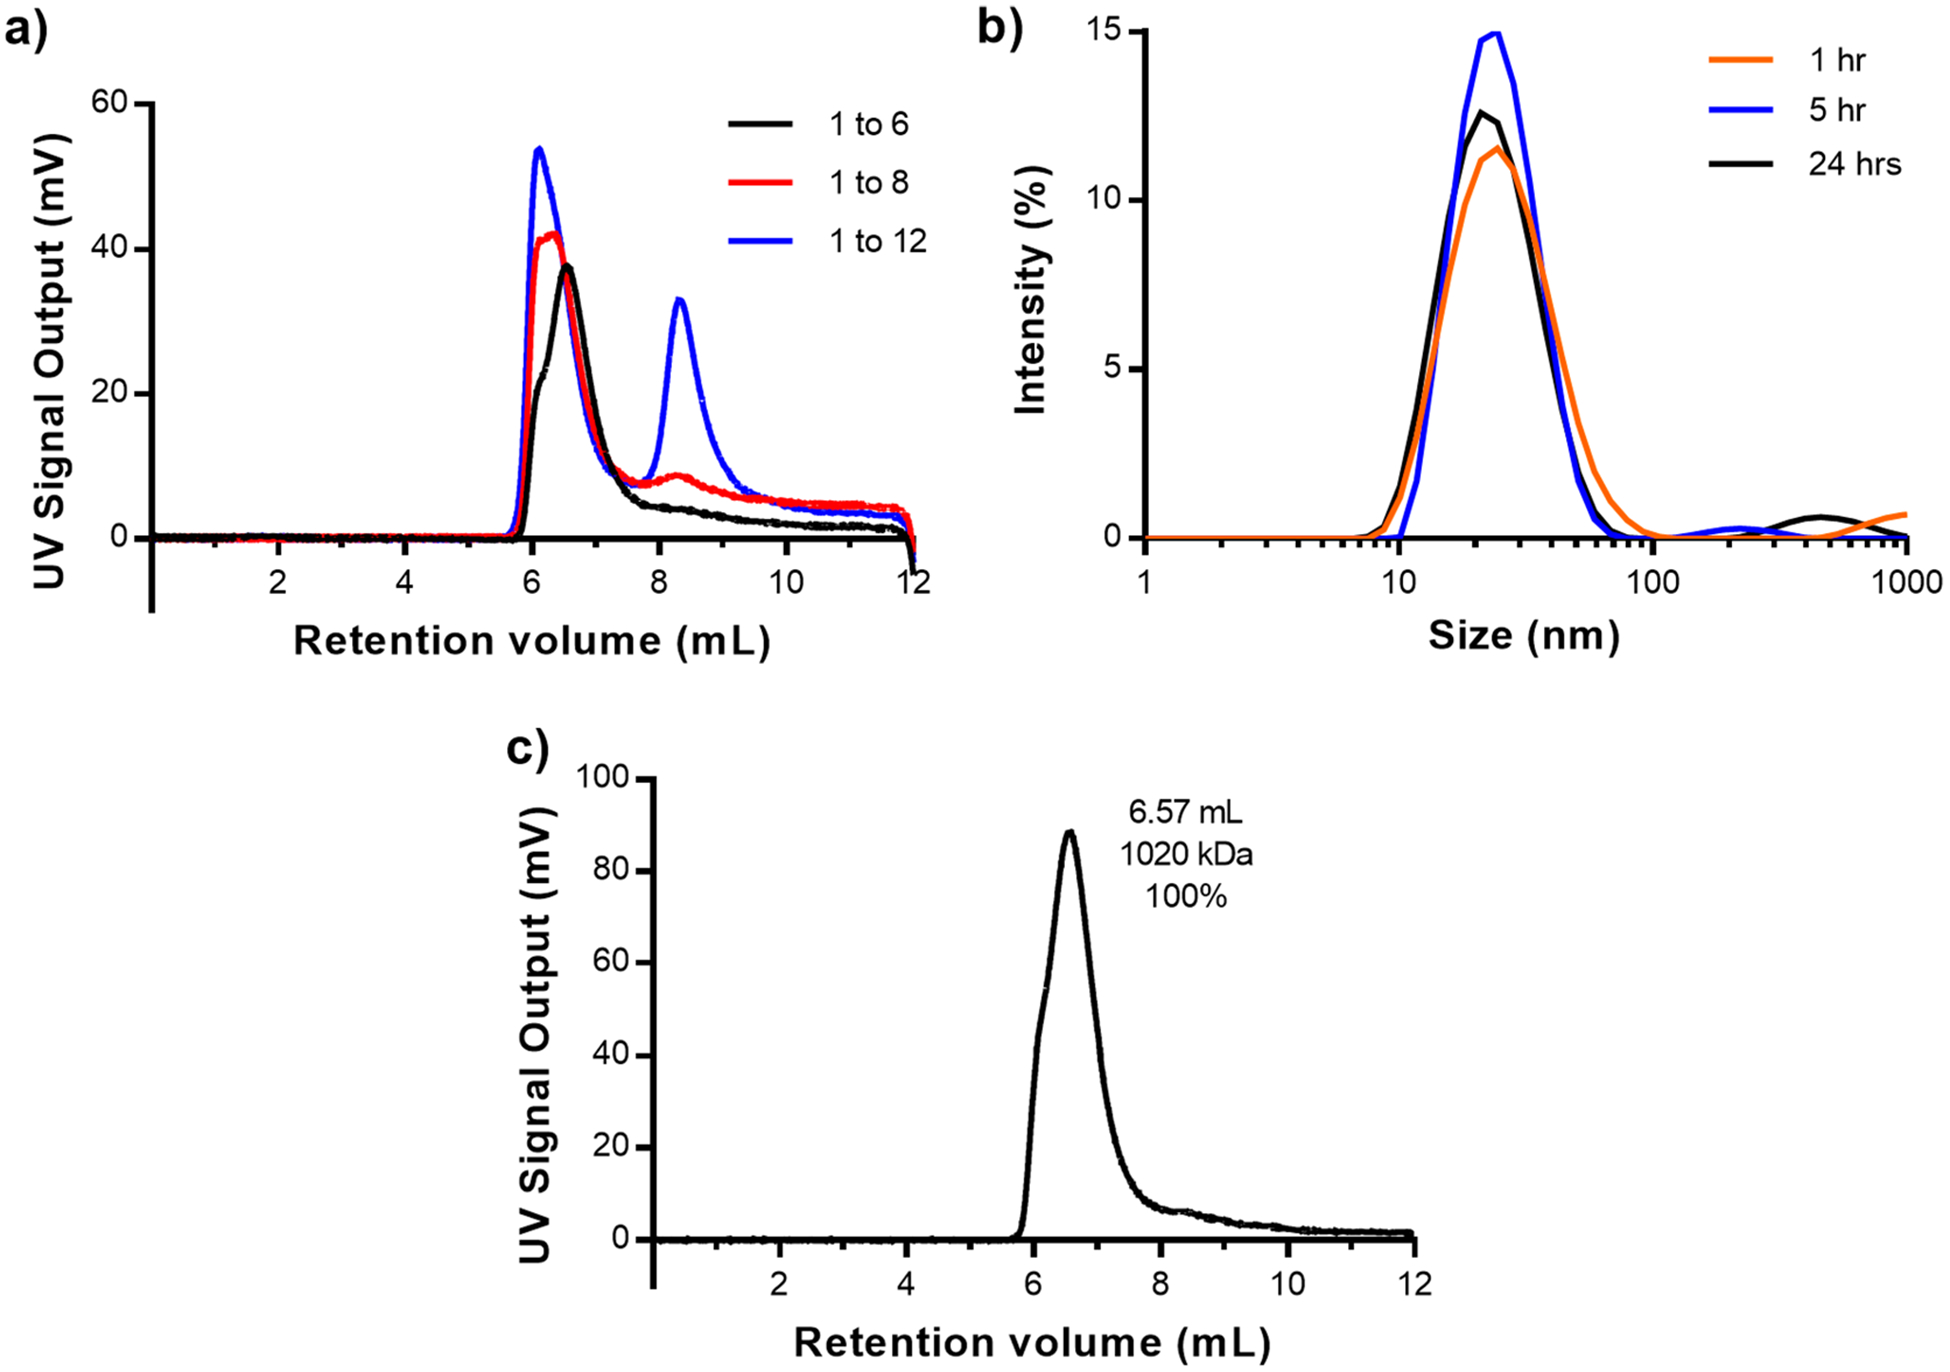
Figure 7.

(a) OmniSEC chromatogram of SHS and IgG mixed in ratios of 1 SHS to 6, 8, and 12 IgG. Peaks at 8.5 mL are indicative of unbound IgG. (b) DLS intensity plot of SHS–IgG in a 1:6 ratio incubated at 37 °C over 24 h. (c) OmniSEC chromatograms and peak analysis for SHS–IgG samples incubated at 37 °C for 10 h.
