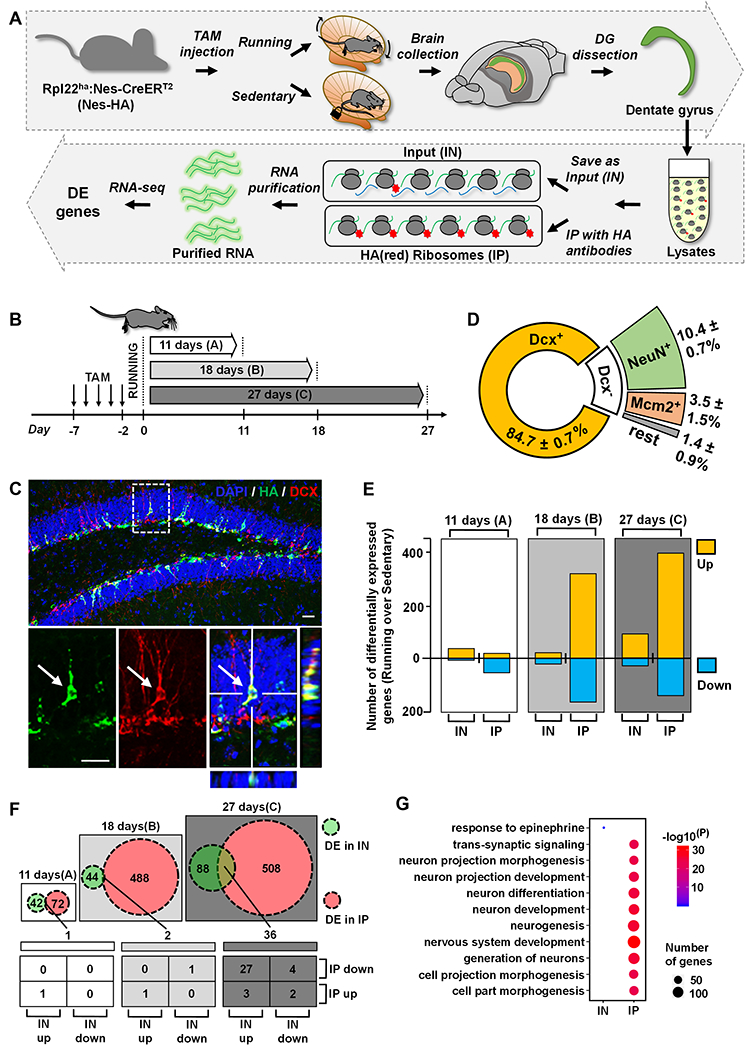
Figure 1. Adult-born hippocampal neurons mount unique and dynamic translational responses to voluntary running.

(A) A schematic drawing of the experimental design for translational profiling of adult new neurons in running and sedentary mice using RiboTag-Seq.
(B) Experimental scheme for RiboTag-Seq of mice subjected to running and sedentary treatments for three different time periods.
(C) Confocal images showing that most HA-positive (HA+, green) cells are Doublecortin-positive (DCX+, red) in 18-days sedentary mice. Scale bar, 50μm.
(D) Pie chart depicting the percentages of DCX+, NeuN+ and MCM2+ in HA+ cells in 18-days sedentary mice.
(E) Bar chart depicting numbers of upregulated or downregulated genes in the IN and IP samples in running mice.
(F) Numbers of shared differentially expressed genes (DEGs) in the IN and IP samples in running mice.
(G) GO analysis (top biological process GO terms) of the unique DEGs in the IN and IP in 27-days samples (the “88 genes” (IN) and “508 genes” (IP) in figure F).
