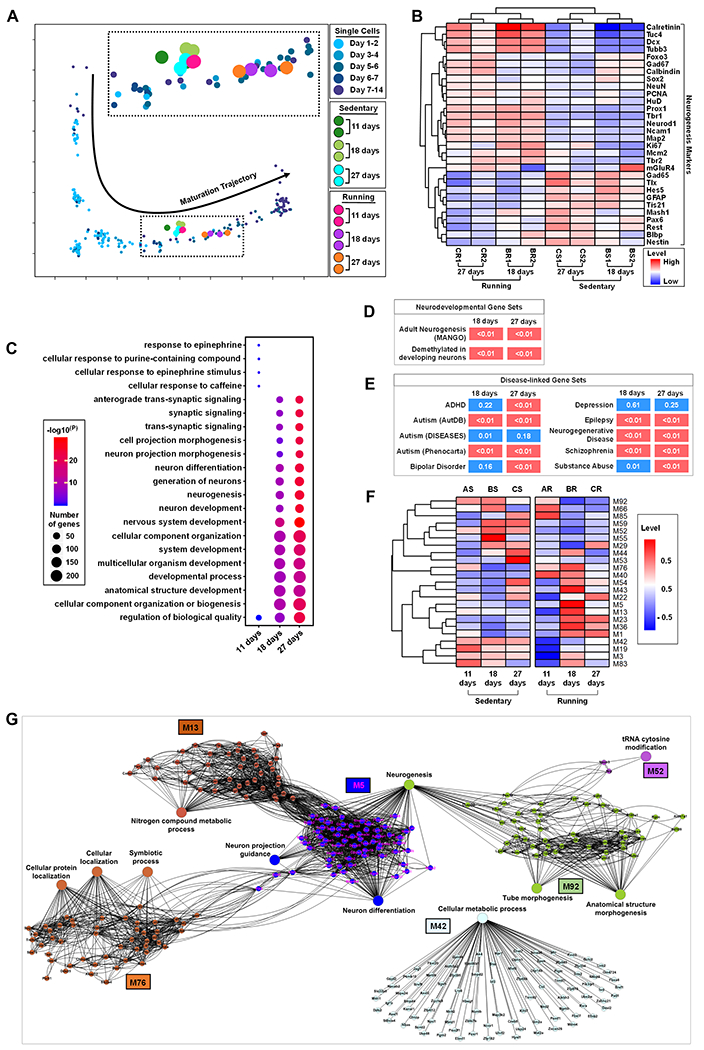
Figure 2. Adult New Neurons Exhibit Dynamic Gene Express Changes Across Stages of Neurogenesis in Response to Running.

(A) Mapping of IP samples from running and sedentary mice in neuronal maturation single cell trajectory.
(B) Heatmap of 30 known neurogenesis related markers in 18-days and 27-days IP samples in sedentary and running mice.
(C) GO analysis of DEGs in 11-days, 18-days and 27-days running mice.
(D) Enrichment of 18-days and 27-days DEGs that are implicated in adult hippocampal neurogenesis and DNA demethylation in neurons during postnatal cortical development.
(E) Enrichment heatmap for disease-related genes in 18-days and 27-days DEGs. Diseases are represented by rows and DEGs are represented by columns. P values are shown in each cell and are color coded (<0.01 (red) and >0.01 or =0.01 (blue)). The Autism1 gene set was curated by Phenocarta, Autism2 by AutDB, and Autism3 by the DISEASES database. All other gene sets are from Phenocarta.
(F) Top 23 most different eigengene modules in sedentary and running mice.
(G) Gene network of the top 23 eigengene module genes in (F).
