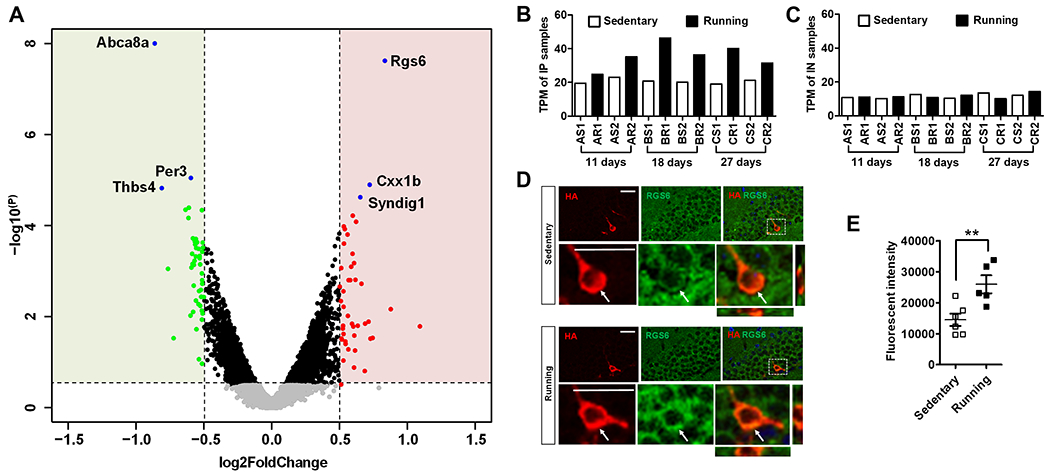
Figure 3. Adult newborn neurons in running mice have increased RGS6 levels.

(A) A volcano plot showing DEGs between running and sedentary groups. Genes with more than 1.5 fold change (>1.5 or < −1.5-fold) and p-value (<0.05) were indicated with color (green, down regulated; red, upregulated in running).
(B-C) RNA-Seq TPM values showed Rgs6 levels were higher increased in the IP (B), but not in the IN samples (C) in running mice compared to sedentary mice.
(D) Sample confocal images used for quantitative analysis in F, showing RGS6 (green) and HA (red) immunoreactivities in the DG of sedentary and running Nes-HA mice. Scale bar, 25μm.
(E) Quantitative results of RGS6 protein levels in the HA+ cells in 18-days sedentary (n=6) and running (n=5) mice (**, p < 0.01; t-test).
