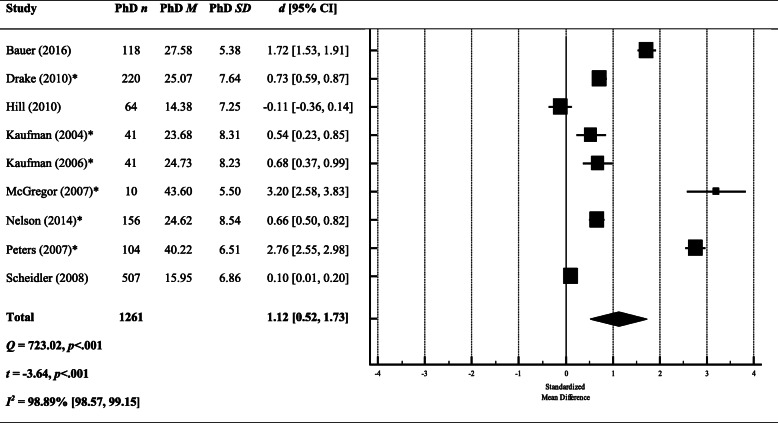
Fig. 2.
A meta-analysis of between-group effect sizes (Cohen’s d) comparing PSS scores (both 10- and 14-item versions) from DRs and normative population data. *Studies using the 14 item version of the PSS; a positive effect size indicates DRs had a higher score on the PSS; a negative effect size indicates that the normative data produced a higher score on the PSS; black diamond = total effect size (based on random effects model); d = Cohen’s d; Q = heterogeneity; Z = z score; I2 = proportion of variance due to between-study heterogeneity; p = exact p value

