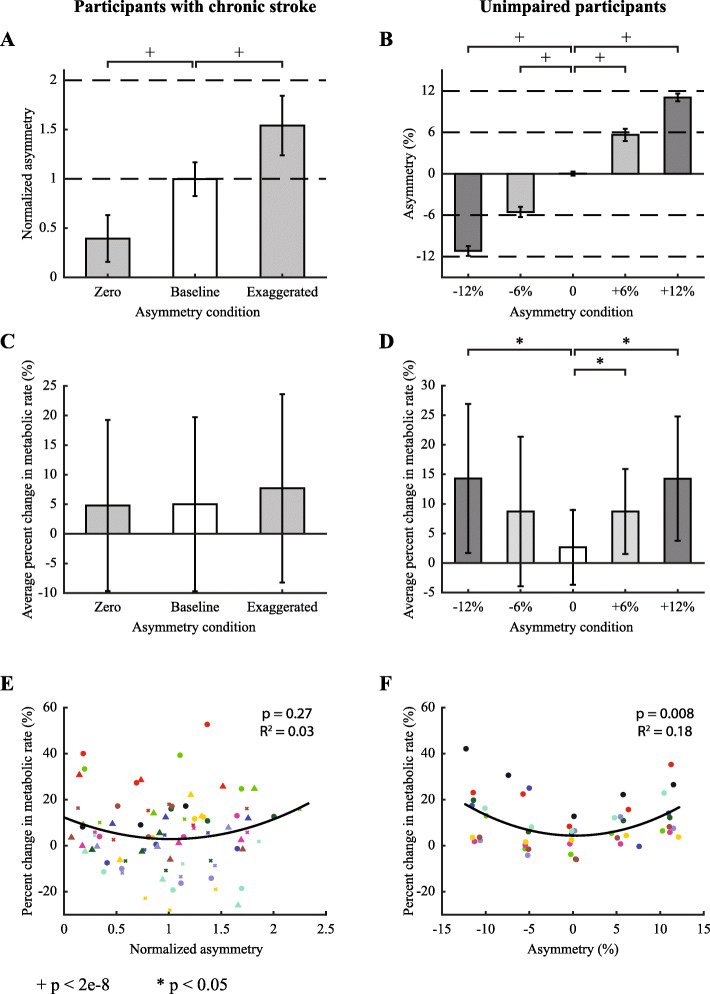
Fig. 4.
Step length asymmetry and metabolic rate results. Results for participants with chronic stroke are on the left and those for unimpaired participants are on the right. a Average measured step length asymmetry across participants with chronic stroke. Asymmetry was normalized to self-selected without biofeedback. b Average measured step length asymmetry for unimpaired participants. Participants in both groups significantly altered step length asymmetry from self-selected as a result of study design. c Average percent change in metabolic rate compared to the self-selected without biofeedback condition. Metabolic rate was unchanged across conditions among participants with chronic stroke. d Metabolic rate increased with increases in absolute step length asymmetry among unimpaired participants. e Metabolic rate versus measured step length asymmetry for all trials among individuals with chronic stroke. Very little of the change in metabolic rate was explained by step length asymmetry. Different colors represent different participants, and different shapes represent different experimental sessions. f A significant trend between metabolic rate and measured step length asymmetry was found for unimpaired participants. Different colors represent different participants

