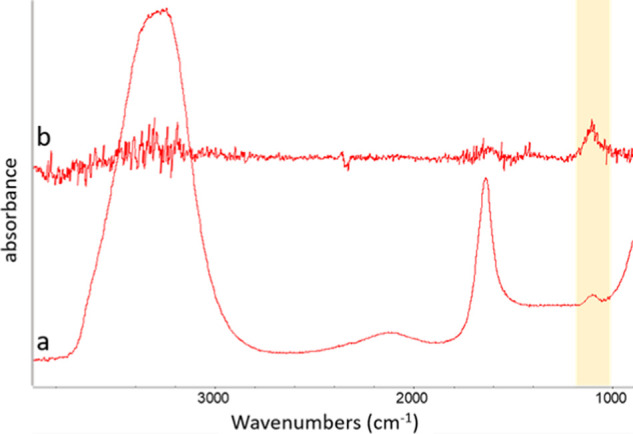
Figure 3.

(a) FTIR-attenuated total reflection (ATR) spectra of a 0.05 M K2SO4 solution and (b) a difference spectrum of the K2SO4 solution before and after a piece of alginate gel was soaked and swelled in it. Note an increase in an absorption band of SO42– (highlighted in yellow), expressed as the positive peak in difference spectra, after the solution contacts with a gel.
