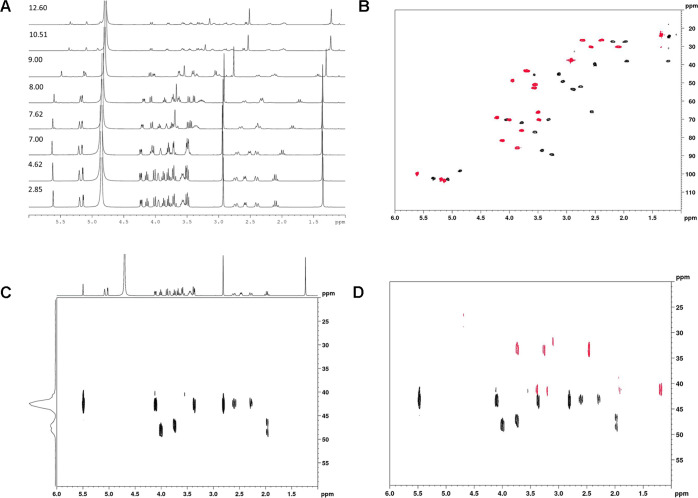
Figure 9.
(A) Stack plot of the 1H NMR spectra of sisomicin with pD increasing from 2.85 to 12.60. During the course of the experiment, the concentration of sisomicin was reduced by the addition of aliquots of NaOD solution to increase the basicity of the solution. As can clearly be seen, there was a little broadening of the signals observed—this implies that while the sisomicin bases were undergoing protonation/deprotonation, the rate of this was significantly faster than the NMR time scale. This allowed for convenient monitoring of the relevant shifts. (B) Overlay plot of the 13C–1H HSQC spectra of sisomicin with pD from 2.85 (red) to 12.60 (black), illustrating the shifts evidenced by both the protons and the carbon atoms. The 13C chemical shifts can be determined directly from the HSQC spectra or from a 1D-projection of the cross-peak data. Both sets of data were referenced using trimethylsilylpropanoic (TMSP) as 0.00 ppm for both 13C and 1H. (C) 15N–1H HMBC spectrum for sisomicin at pD 2.50. Individual 15N chemical shifts were obtained directly from the two-dimensional (2D) plot and can also be seen in the projected spectrum (a sum of the peaks presenting in the 2D spectrum between 6.0 and 1.5 ppm). Note that the intensity of the projected spectrum is related to the number of peaks and the strength of the correlation and has no other significance. The HMBC spectrum was acquired at 500.13 MHz for 1H and 50.67 MHz for 15N using the Bruker hmbcgpndqf pulse sequence. The data were acquired at 25 °C. TD was 2048 in the F2 dimension and 256 in the F1 (all ns = 4). Relaxation delay (d1) was 2.92 s. SW was 8.77 ppm for 1H and 450 ppm for 15N. 15N was referenced externally to nitromethane. For processing, SI was 4096 for F2 and 1024 for F1. The total time for acquisition was ∼45 min. (D) Overlay of the 15N–1H HMBC spectra for sisomicin at pD 2.50 (in black) and at pD 12.55 (in red), showing the shifts in both 1H and 15N spectra (all ns = 4). For assignment, the nitrogen cross-peaks are correlated to the protons and followed during the course of the titration experiment.

