Figure 4.
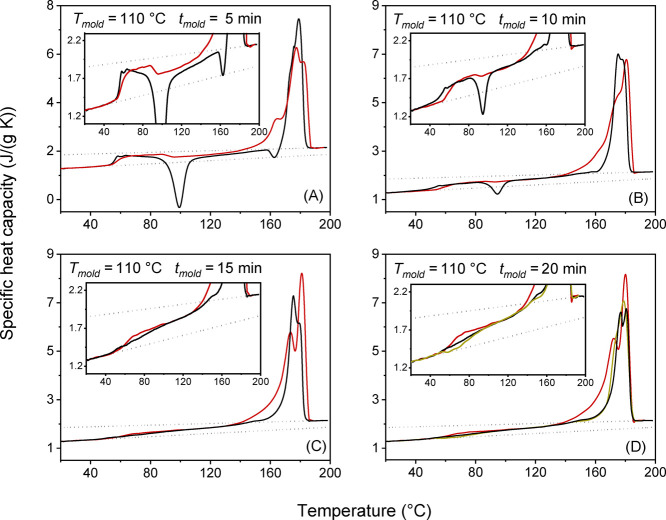
(A−D) Apparent specific heat capacity (cp,app, black lines) at the heating rate of 10 K/min, and reversing specific heat capacity (cp,rev, red lines) at the average heating rate of 2 K/min (p = 120 s) for PLLA after molding at Tmold = 110 °C for the indicated molding times (tmold). The apparent specific heat capacity (cp,app) at the average heating rate of 2 K/min (yellow line) is also shown for tmold = 20 min. The insets are enlargements of the cp,app and cp,rev curves. The black dotted lines are the thermodynamic solid and liquid specific heat capacities (cps and cpl) of PLLA, adapted with permission from ref (44). Copyright (2005) American Chemical Society.

