
Extended Data Figure 6. RREB1-dependent TGF-β responses in LUAD and PDA cells.
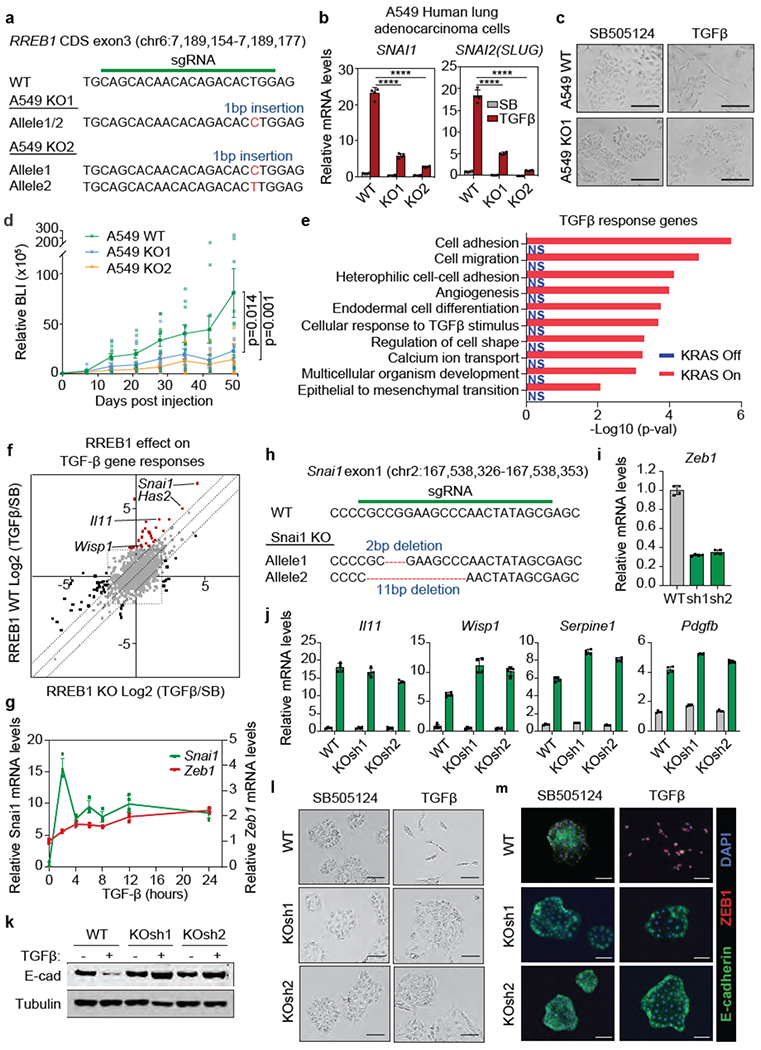
(a) sgRNA sequence targeting RREB1 CDS exon3, and mutant RREB1 genomic sequences of the resulting A549 KOI and KO2 clones, (b) SNAIL and SLUG mRNA levels in WT A549 and two RREB1 KO clones treated with SB or TGF-β for 24 h. Mean ± s.e.m. n=4, two-way ANOVA analysis. ****, p<0.0001. (c) Phase contrast images of WT A549 and RREB1 KO cell monolayers treated with SB or TGF-β for 48 h. Scale bars, 200 μm. Data are representative of two independent experiments. (d) Growth kinetics of tumours formed by subcutaneously inoculated WT or RREB1 KO A549 cells in athymic mice, as determined by BLI of a transduced firefly luciferase gene in the cells. Mean ± s.e.m. n=10, two sites were inoculated per mouse, two-way ANOVA analysis, (e) Gene ontology analysis of TGF-β response genes in CIY organoids inducibly expressing KRASG12D, based on the RNA-seq in Extended Data Fig. 1b. (f) RREB1 WT and KO PDA cells were treated with SB or TGF-β for 1.5 h and subjected to RNA-seq analysis. Dots represent Log2 (fold change) in mRNA levels of individual genes under TGF-β versus SB treatment conditions, in RREB1 KO (X axis) or WT cells (Y axis). Off-diagonal dots corresponding to Snai1, Has2, Il11 and Wisp1 are highlighted, (g) Induction of Snai1 and Zeb1 expression by TGF-β in mouse PDA cells. Mean ± s.d. n=4. (h) sgRNA sequence targeting Snai1 and resulting mutant Snai1 genomic sequences in mouse PDA cells (i) Knockdown of Zeb1 with two independent shRNAs in SNAIL KO mouse PDA cells (KOsh cells). Mean ± s.d. n=4. (j) Fibrogentic gene responses to TGF-β in WT and SNAIL/ZEB1-doubly depleted KOsh PDA cells. Mean ± s.d. n=4. (k-m) E-cadherin levels (k), phase contrast images (I), and E-cadherin and Zeb1 immunofluorescence staining in WT and KOsh PDA cells that were treated with SB or TGF-β for 48h. Scale bars, 100 μm. Data are representative of two independent experiments.