
Extended Data Figure 7. RREB1 dependent TGF-β responses in mammary epithelial cells.
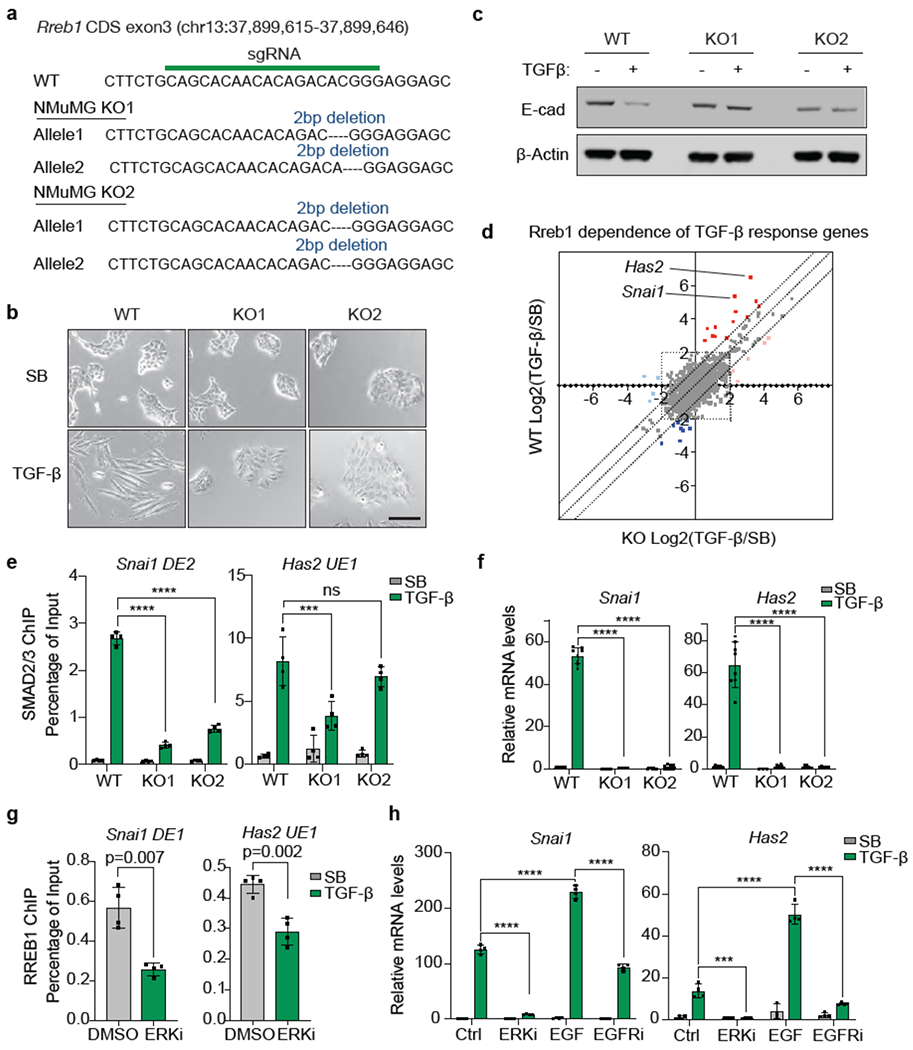
(a) sgRNA sequence targeting RREB1 CDS exon3, and mutant RREB1 genomic sequences of the resulting NMuMG KO1 and KO2 clones, (b) Phase contrast images of RREB1 WT and KO NMuMG cell monolayers treated with SB or TGF-β for 48 h. Scale bar, 100 μm. Data are representative of two independent experiments, (c) Western immunoblot analysis of E-cadherin in RREB1 WT and KO NMuMG cells, treated with SB or TGF-β for 48 h. Anti-β-actin immunoblotting was used as loading control. Data are representative of two independent experiments, (d) RREB1 WT and KO NMuMG cells were treated with SB or TGF-β for 1.5 h and subjected to RNA-seq analysis. Dots represent Log2 fold change in mRNA levels of individual genes under TGF-β versus SB treatment conditions, in RREB1 KO (X axis) or WT cells (Y axis). Off-diagonal dots corresponding to Snai1 and Has2 are highlighted, (e) ChIP-PCR analysis of SMAD2/3 binding to the Snai1 (DE2) and Has2 (UE1) regions (refer to Fig. 1g) in RREB1 WT and KO NMuMG cells. Cells were treated with 2.5 μM SB or 100 pM TGF-β for 1.5 h. Mean ± s.e.m. n=4. two-way ANOVA analysis. ***, p<0.001; ****, p<0.0001. (f) mRNA levels of Snai1 and Has2 in RREB1 WT and KO NMuMG cells after treatment with SB or TGF-β for 1.5 h. Mean ± s.e.m. n=4. two-way ANOVA analysis. ****, p<0.0001. (g) ChIP-PCR analysis of HA-RREB1 binding to the indicated Snai1 and Has2 regions in NMuMG cells that were treated with vehicle DMSO or the ERKi SCH772984 (1 μM) for 6 h. Mean ± s.e.m. n=3, two-tailed unpaired t test, (h) Snai1 and Has2 mRNA levels in NMuMG cells treated with DMSO (Ctrl), ERKi (1 μM SCH772984), EGF (10 ng/ml, 10 min), or EGFR inhibitor (Gefitinib, 1 μM, 2 h), followed by SB or TGF-β treatment for another 1.5 h. Mean ± s.e.m. n=4. two-way ANOVA analysis. ***, p<0.001; ****, p<0.0001.