
Extended Data Figure 8. RREB1 in gastrulation EMT and mesendoderm differentiation.
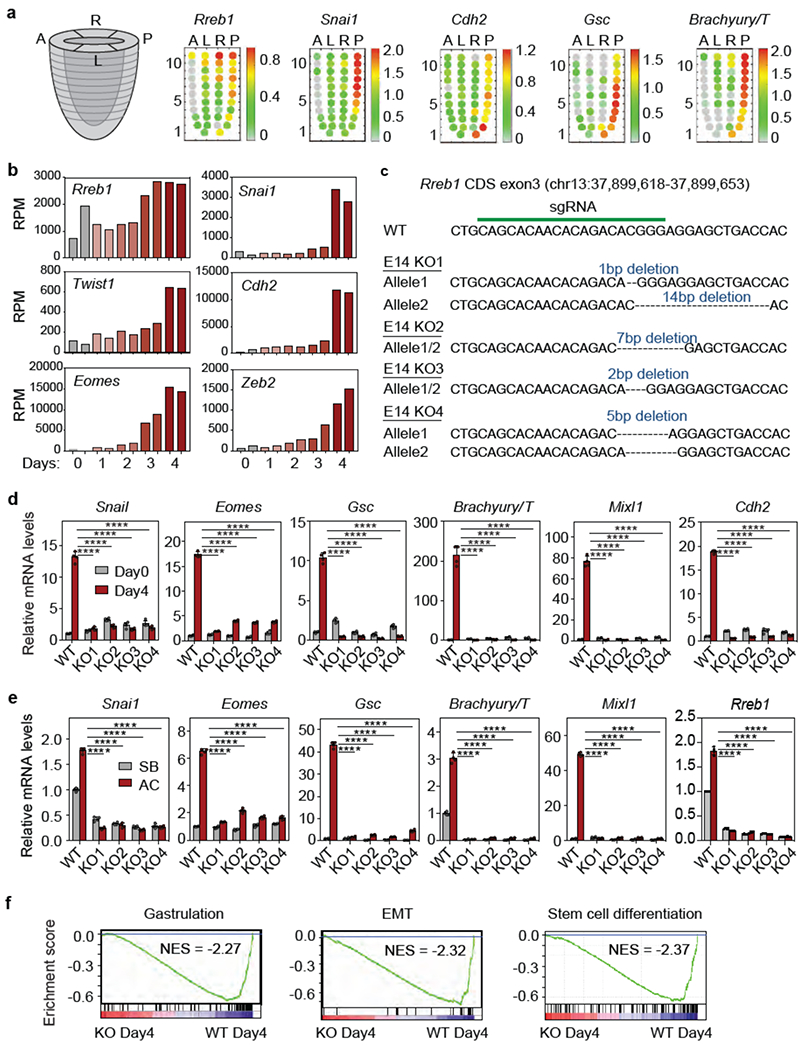
(a) Corn plot presentation of Rreb1, Snai1, Cdh2, Gsc and Brachyury/T in E7.0 mouse embryo. A: anterior, L: left, R: right, P: posterior regions. Each dot represents transcript level at a specific positional address. Heatmap denotes expression level of each gene computed from transcript counts in RNA-seq datasets41, (b) Reads per million reads (RPM) of Rreb1, Snai1, Twist1, Cdh2, Eomes and Zeb2 in the RNA-seq dataset at the indicated times after shifting ESCs into LIF-deficient EB differentiation media, (c) sgRNA sequence targeting Rreb1 CDS exon3, and mutant Rreb1 genomic sequences of four resulting mESC KO clones, (d) mRNA levels of EMT (Snai1, Cdh2) and mesendoderm differentiation genes (Eomes, Gsc, T/Brachyury and Mixi1) in WT and four independent RREB1 KO clones on Day4 EB differentiation. Mean ± s.d., n=4, two-way ANOVA analysis. ****, p<0.0001. (e) mRNA levels of the indicated genes in WT and four independent RREB1 KO clones treated with receptor inhibitor (SB) or Activin A (AC) for 2 h. Mean ± s.e.m. n=4, two-way ANOVA analysis. ****, p<0.0001. (f) GSEA for gastrulation, EMT and stem cell differentiation genes in WT cells, and absence in RREB1 KO cells, at Day4 EB differentiation.