
Figure 2. RREB1 mediates KRAS and TGF-β dependent EMT.
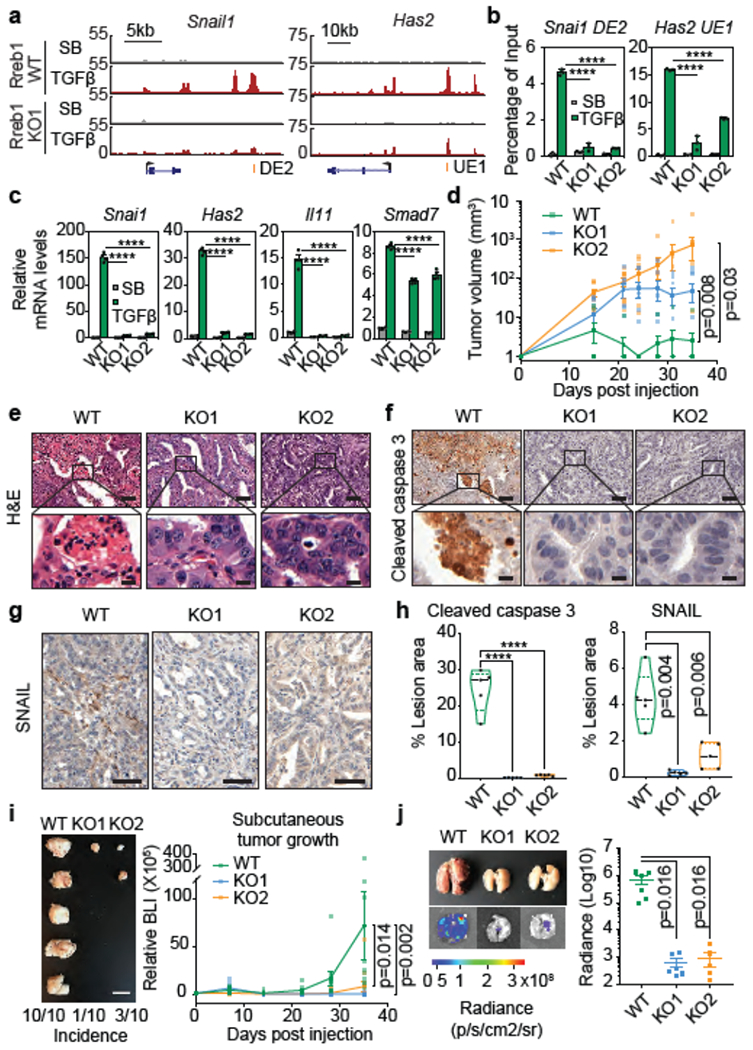
(a) Gene track view of SMAD2/3 ChIP-seq tags at indicated loci of RREB1 WT and KO SMAD4-restored mouse PDA cells. Gene bodies represented at the bottom of track sets. DE: downstream enhancer, UE: upstream enhancer. ChIP-seq was performed once and an independent ChIP was performed in which selected genomic regions were confirmed by qPCR. (b) ChIP-PCR analysis of SMAD2/3 binding to indicated sites of Snai1 (DE2) and Has2 (UE1) in RREB1 WT and KO PDA cells after treatment with SB (2.5 μM) or TGF-β (100 pM) for 1.5 h. Mean ± s.e.m. n=4, two-way ANOVA analysis, ****, p<0.0001. (c) Levels of Snai1, Has2, Il11, and Smad7 in RREB1 WT and KO PDA cells after treatment with SB (2.5 μM) or TGF-β (100 pM) for 1.5 h. Mean ± s.e.m. n=4, two-way ANOVA analysis, ****, p<0.0001. (d) Volume of RREB1 WT and KO SMAD4-restored PDA tumours after subcutaneous inoculation in syngeneic FVB mice. Mean ± s.e.m. n=10 tumours, 5 mice per group, two-way ANOVA analysis. (e,f) Representative hematoxylin and eosin staining (e), cleaved caspase-3 immunohistochemistry (IHC) (f) and SNAIL IHC (g) images of subcutaneous tumours formed by RREB1 WT and KO SMAD4-restored PDA cells 35 days after inoculation. Scale bars (e-f) upper panels, 50 μm; (e-f) lower panels, 10 μm; (g) 50 μm. (e-g) Images are representative of five biological replicates. (h) Quantification of cleaved caspase-3-positive and SNAIL-positive cells in PDA tumour sections. n=5 per group, two-tailed unpaired t test. ****, p<0.0001. Violin plots: midline, median; dotted lines, 25% and 75% quartiles. (i) Images of subcutaneous tumours formed by RREB1 WT or KO 393T3 lung adenocarcinoma cells in syngeneic B6129SF1/J mice excised 35 days after inoculation. Scale bars of left panel, 10 mm. Tumour growth monitored by firefly luciferase bioluminescence imaging (BLI) plotted over time (right panel). Mean ± s.e.m. n=10 tumours, 5 mice per group, two-way ANOVA analysis, (j) Representative ex vivo brightfield and BLI of lungs from mice inoculated via tail vein to test lung colonizing activity of RREB1 WT or KO 393T3 cells. Lungs excised and imaged 21 days after inoculation. Lung colonization load was determined by quantitative BLI. Mean ± s.e.m. n=6 mice per group, two-tailed unpaired t test. See also Extended Data Figure 4–6.