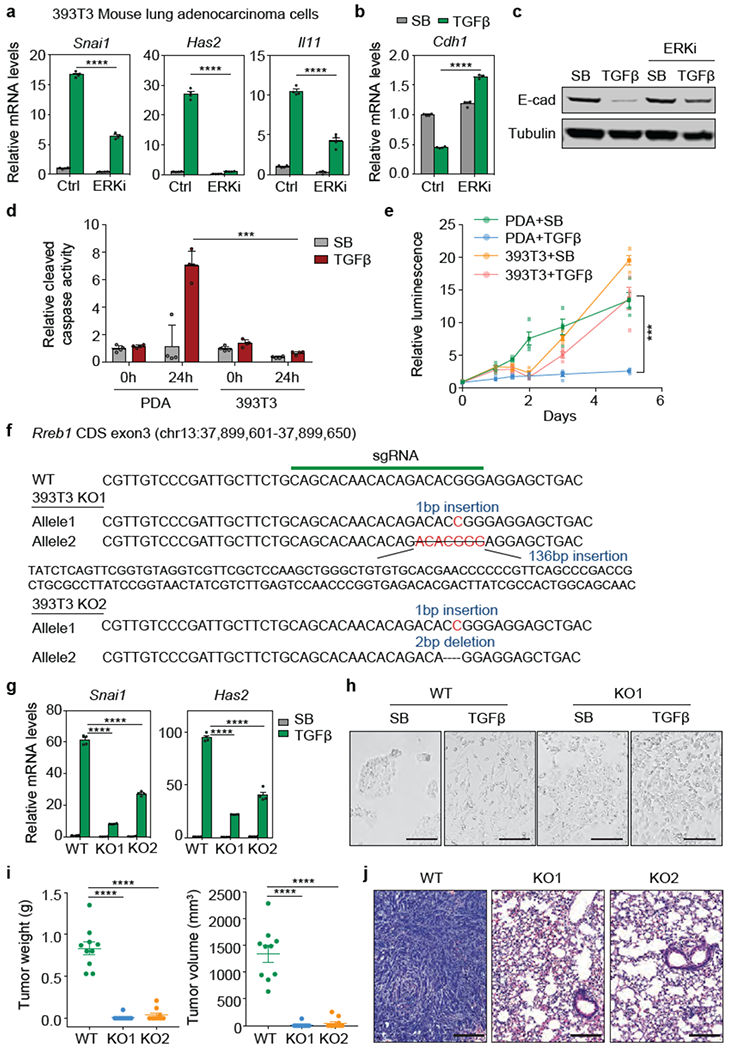
Extended Data Figure 5. RREB1 mediates tumorigenic EMT in lung adenocarcinoma cells.

(a) Snai1, Has2 and Il11 mRNA levels in 393T3 mouse LUAD cells treated with DMSO (Ctrl) or ERKi (SCH772984, 1 μM) for 6 h, followed with treatment of SB or TGF-β for 1.5 h. Mean ± s.e.m. n=4, two-way ANOVA analysis, ****, p<0.0001. (b) Cdh1 mRNA levels in 393T3 cells with the indicated treatments for 48 h. Mean ± s.d. n=4, two-way ANOVA analysis, (c) Western immunoblot analysis of E-cadherin in 393T3 cells with the indicated treatments for 48 h. Anti-Tubulin immunoblotting was used as loading control. Data are representative of two independent experiments, (d) SMAD4-restored PDA cells and 393T3 LUAD cells cultured in D10F containing 2.5 μM MK220612 were treated with SB (2.5 μM) or TGF-β (100 pM) and assayed for cleaved caspase 3/7 activity at the indicated times. Mean ± s.e.m. n=4, two-way ANOVA analysis, ***, p<0.001. (e) SMAD4-restored PDA cells and 393T3 cells cultured in D10F containing 2.5 μM MK2206 were treated with SB or TGF-β. Cell viability was determined at the indicated times. Mean ± s.e.m. n=4, two-way ANOVA analysis, ***, p<0.001. (f) sgRNA sequence targeting Rreb1 CDS exon3, and mutant Rreb1 genomic sequences of the resulting 393T3 KO1 and KO2 clones, (g) mRNA levels of Snai1 and Has2 in the RREB1 WT and KO 393T3 cells after treatment with SB (2.5 μM) or TGF-β (100 pM) for 1.5 h. Mean ± s.e.m. n=4, two-way ANOVA analysis. ****, p<0.0001. (h) Phase contrast images of 393T3 cell monolayers treated with SB or TGF-β for 48 h. Scale bars, 200 μm. Data are representative of two independent experiments, (i) Weight and volume of tumours in Fig. 2g. Mean ± s.e.m. n=10, two sites were inoculated per mouse, two-tailed unpaired t test. ****, p<0.0001. (j) Representative hematoxylin and eosin staining images of indicated lung tissue sections in Fig. 2h. Scale bars, 200 μm. Data are representative of two independent experiments.
