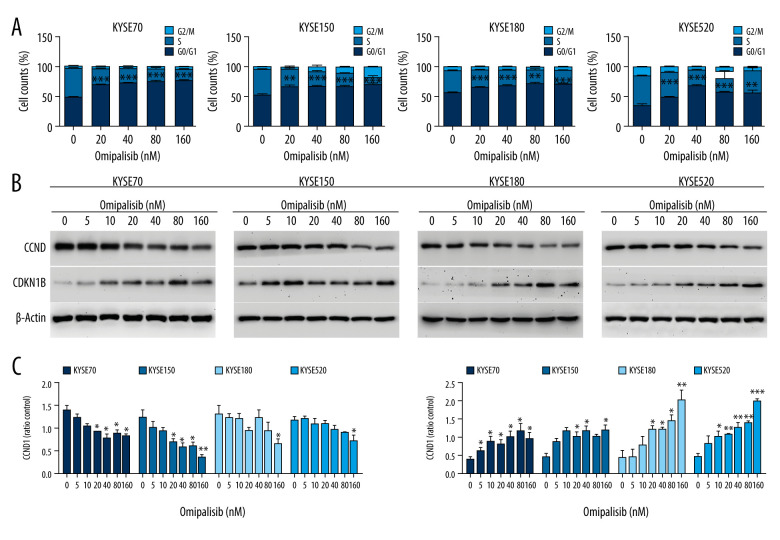
Figure 4.
Omipalisib induced cell cycle arrest of Esophageal squamous cell carcinoma (ESCC) cells. (A) Representative data of 3 independent experiments in cell cycle distribution determined by flow cytometry in ESCC cells exposed to omipalisib for 24 hours. (B) Representative image of protein expression of 3 independent experiments in 4 ESCC cells exposed to omipalisib for 24 hours. (C) Density analysis of protein bands performed with ImageJ software. Plot is the average of 3 independent experiments. (* P<0.05, ** P<0.01, *** P<0.001).

