
Figure 4.
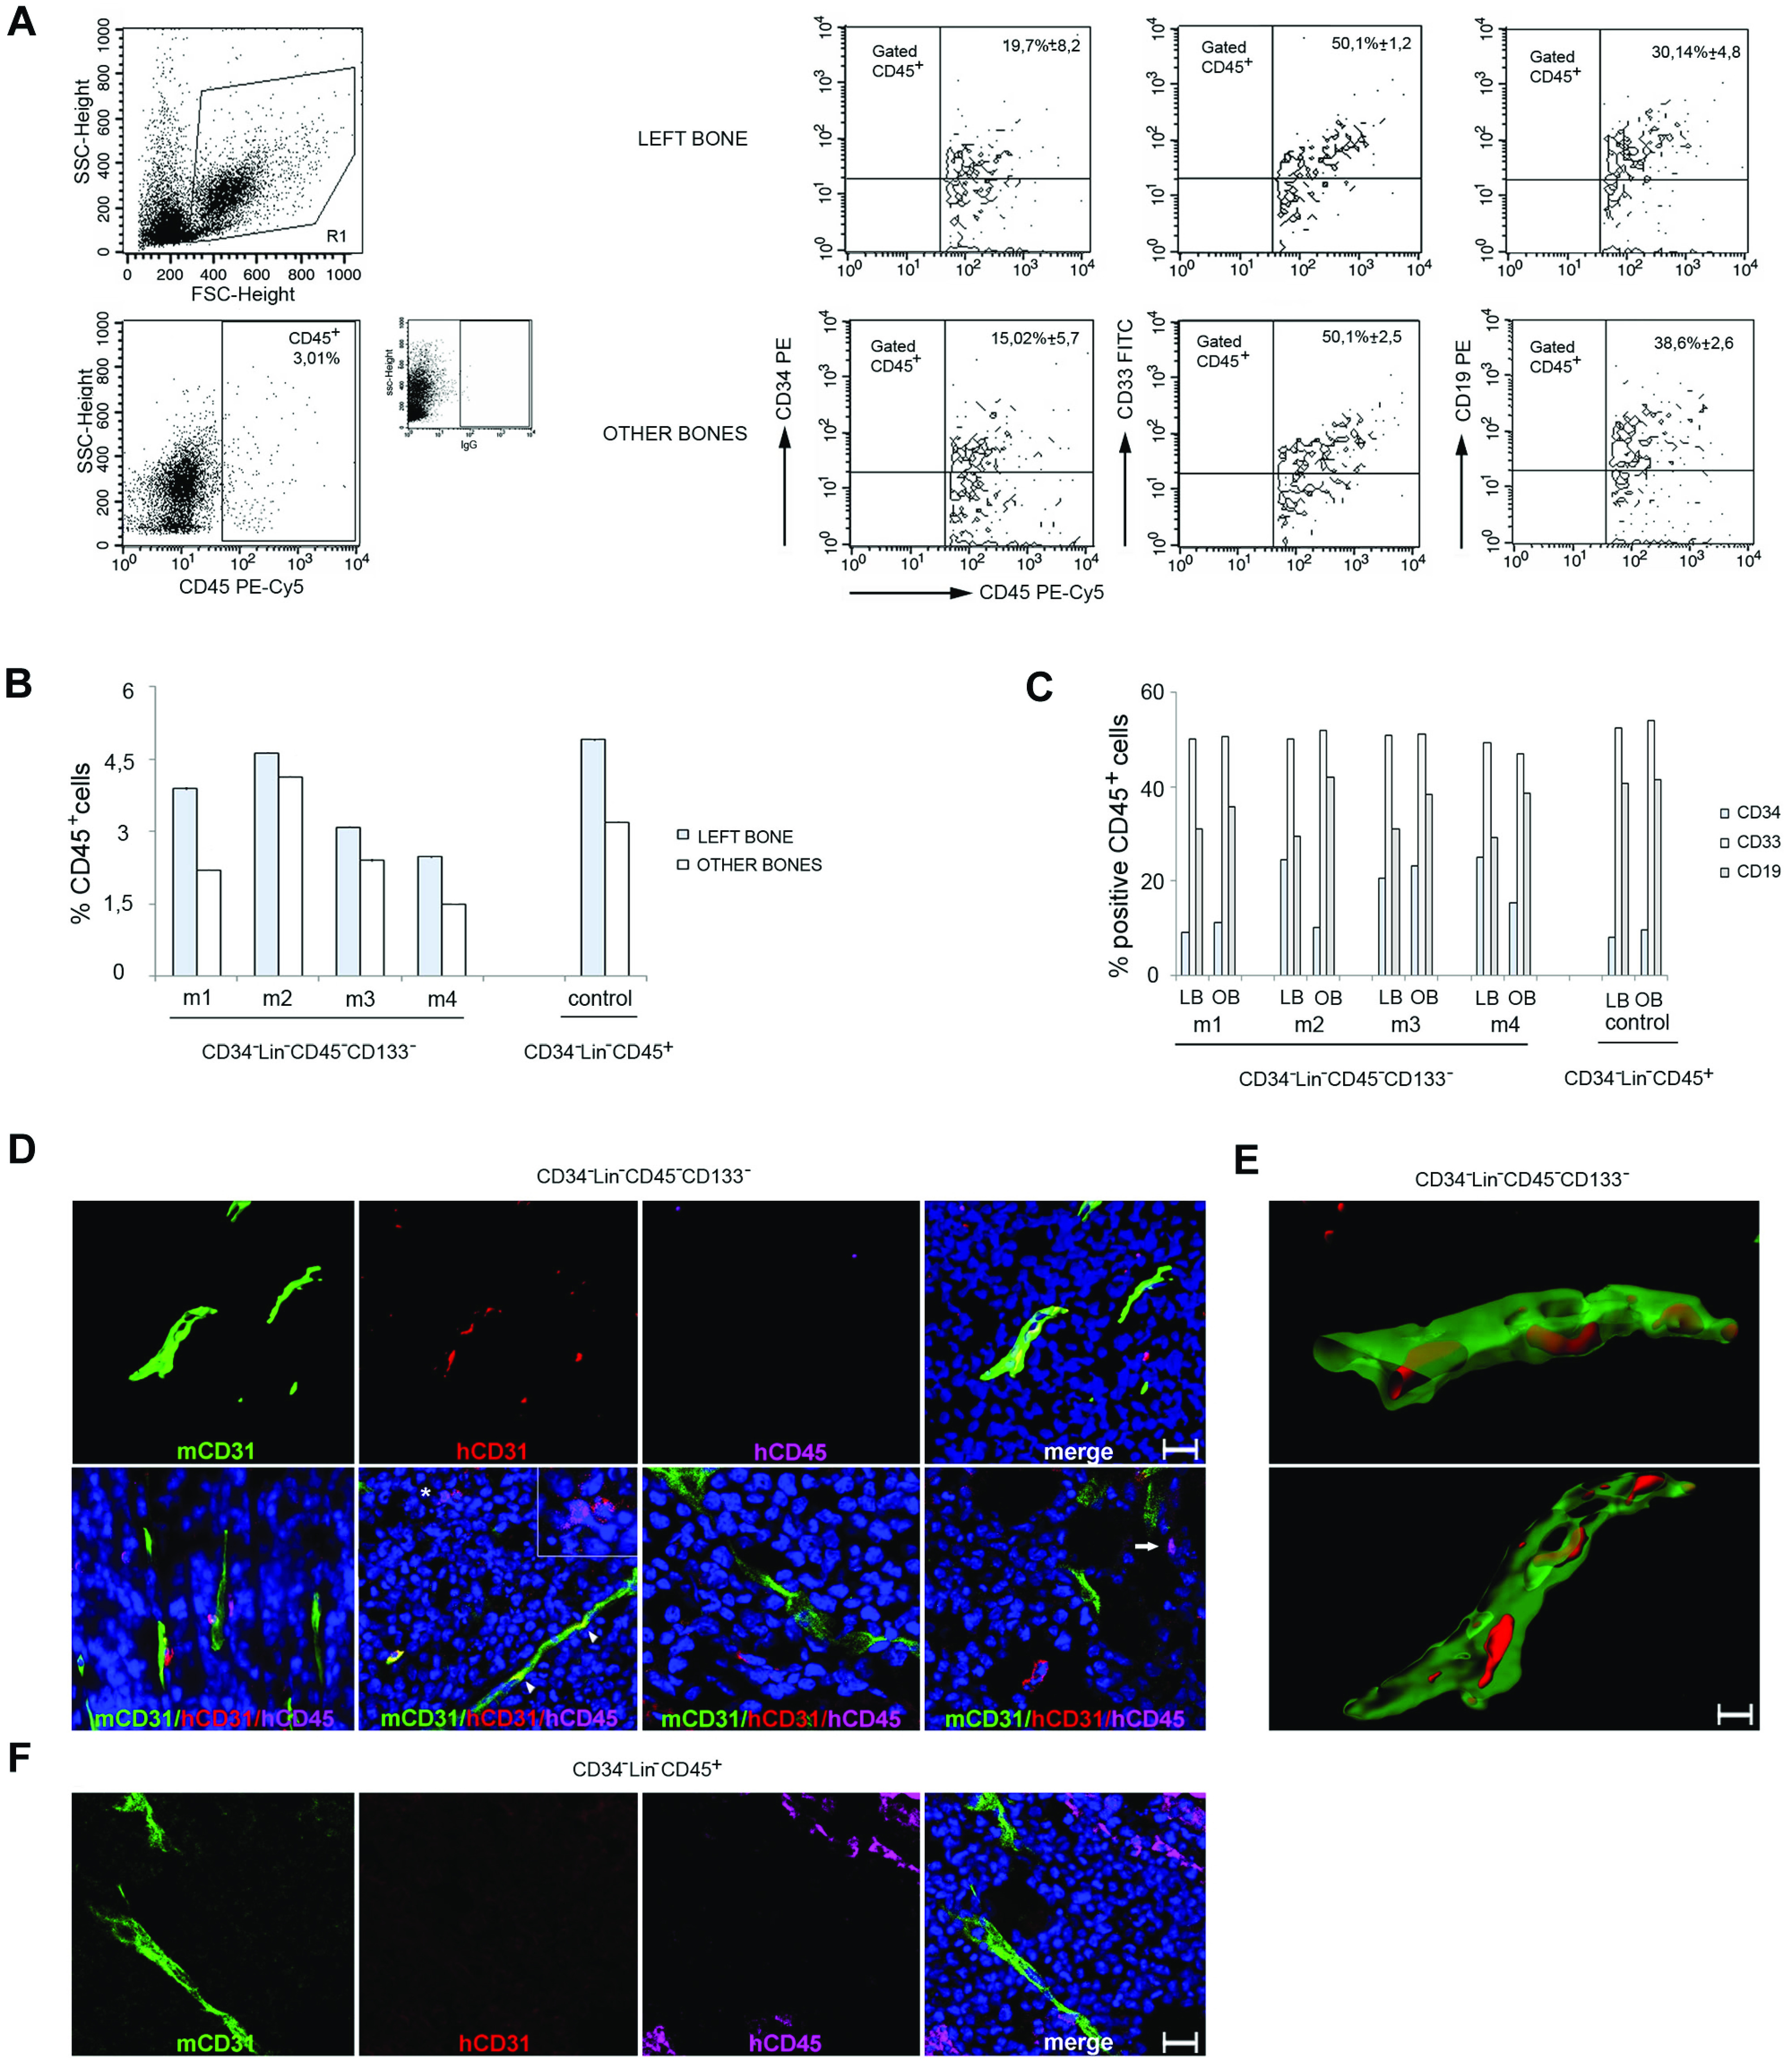
Adult human CD34−Lin−CD45−CD133− cells give rise to both hematopoietic and endothelial lineage cells in NOD/SCID mice. (A) Example of multilineage human hematopoietic (CD45+) reconstitution of BM cells from the IBMI of NOD/SCID recipients receiving CD34−Lin−CD45−CD133− cells that include CD34 (stem/progenitor hematopoietic cells), CD33 (myeloid), and CD19 (B lymphoid) lineage markers. Representative results from 4 injected mice. (B) Frequency of cells positive for human CD45 staining in the BM of mice that received a transplant. Graph showing the results obtained in each experiment; m indicates mouse. (C) Coexpression of human CD34, CD33, and CD19 by CD45+ in BM cells from the same mice. Graph showing the results obtained in each experiment; m indicates mouse; LB, left bone; and OB, other bones. (D) Mouse CD31, human CD31, and human CD45 immunostaining of MOPC315 tumor tissues from mice injected 4 weeks earlier with 2 × 10² CD34−Lin−CD45−CD133− cells. (Top) Confocal microscopy images (3-dimensional rendering) showing the colocalization of mouse tumor vessels (mouse CD31+) and human CD31+ cells, which fail to costain for human CD45. (Bottom) Confocal microscopy images showing human CD31+/CD45− and human CD45+/CD31− cells proximal or distant from mouse CD31+ vessels. The asterisk points to a human CD45+ cell (pink) adjacent to a human CD31+ cell (red); the cells are shown at a higher magnification in the inset. The arrowheads point to the colocalization (yellow) of mouse CD31 (green) and human CD31 (red) immunostaining. The arrow in the far right panel points to a human CD45+/CD31− cell. Scale bars = 50 μm. (E) Images from clipping and rotation of a 3-dimensional confocal image of a tumor vessel from a mouse injected 4 weeks earlier with CD34−Lin−CD45−CD133− cells showing the spatial relationship between the murine endothelial cells (green, mCD31+) and the human endothelial cells (red, hCD31+) contributing to the vessel wall. Scale bar = 50 μm. (F) MOPC315 tumor tissue from a mouse injected with 1 × 10³ CD34−Lin−CD45+ cells shows vascular structures expressing mouse but not human CD31. Clusters of human CD45+ cells are observed. Results from immunostaining with specific anti–mouse CD31 (green), anti–human CD31 (red), and anti–human CD45 (pink) are shown. Nuclei are detected by DAPI staining (blue). FSC indicates forward scatter.