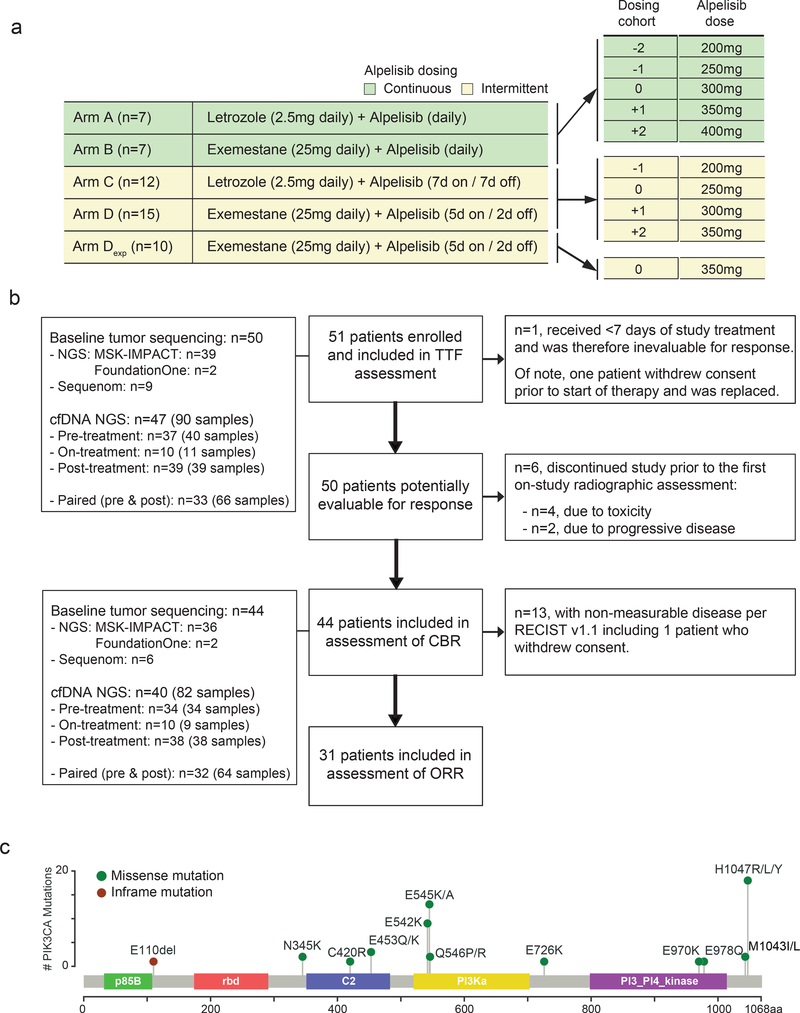
Fig. 1. Study design.
a) Treatment schema and dosing cohorts of the study arms. b) CONSORT diagram of patients included in the TTF, CBR and ORR evaluation. c) Distribution of PIK3CA mutations for the study cohort positioned by their amino acid coordinates across the protein domain based on the pre-treatment tumor sequencing results. Exp: expansion cohort, TFF: time to treatment failure, CBR: clinical benefit rate, ORR: objective response rate, NGS: next generation sequencing.

