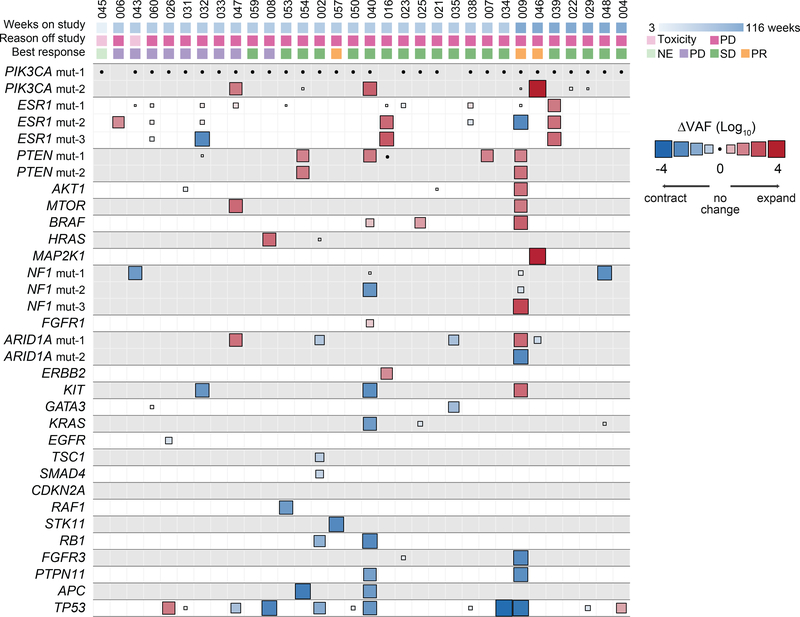
Fig. 5. Change in variant allele fraction (ΔVAF) of known pathogenic mutations in post- vs pre-treatment ctDNA specimens.
Heatmap of change in VAF comparing the post-treatment with pre-treatment ctDNA of 32 evaluable patients (n=64 samples) normalized according to the change in ctDNA fraction as a proxy of change in disease burden. The size of the boxes represents the relative change and the color gradient of the boxes represent increase or decrease in ΔVAF. The top section shows the time to treatment failure (weeks), reason off study, and the best response on therapy. Multiple mutations in a same gene are indicated, for example patient #47 had two different PIK3CA mutations with one mutation having no change whilst the other one expanded in the post-treatment sample (positive ΔVAF). PR: partial response, SD: stable disease, PD: progressive disease, NE: not evaluable for response.

