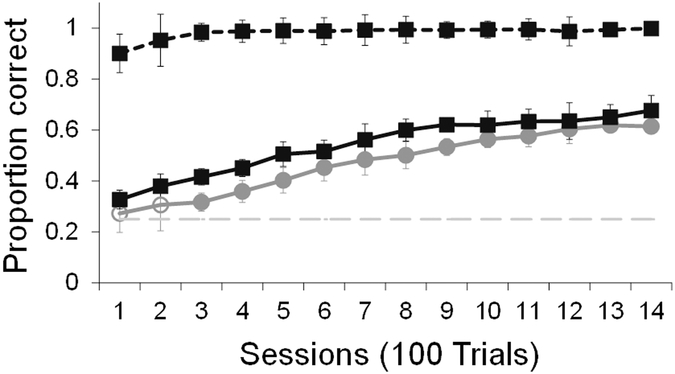
Figure 4.
Average performance across the four repetitions of experiment 2. Solid lines indicate accuracy on trial-and-error trials that do not involve exclusion for the exclusion image set (black) and basic image set (grey). The dotted black line indicates accuracy on exclusion trials. The dashed grey line indicates chance level, error bars indicate standard errors. Filled data markers indicate above chance performance, empty data markers indicate performance that does not differ from chance.

