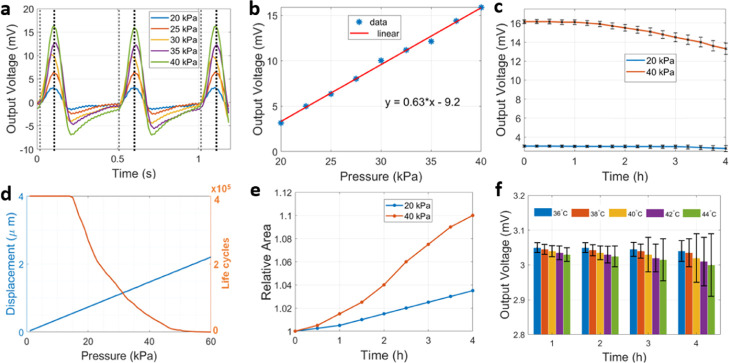
Figure 4.
(a) Voltage signals produced by repeated application of different loads (pressure) to the force sensor every 0.5 s, with vertical marks identifying the moment of force contact (dashed gray line) and release (dashed black line). (b) Linear polynomial fit obtained between the applied load and output voltage (maximum value) produced by the force sensor. (c) Evolution of the output voltage (mean value and error bars) for the force sensor during extended repetitive load application with two different intensities (20 and 40 kPa): statistics were calculated in intervals of 15 min during the experiment, with load cycles lasting 0.5 s each. (d) Mechanical simulations showing the evolution of maximum element displacement (in blue) inside the sensor as a function of the applied pressure, as well as the maximum number of life cycles expected for the sensor during fatigue analysis (in orange). (e) Structural evolution of the central sensing area as a function of time, in relation to the original fabricated area (1 mm × 0.5 mm) for two different loads (20 and 40 kPa). (f) Thermal stability analysis in terms of the voltage signal produced by the force sensor for different temperature profiles within the physiological range. Statistics obtained for the mean values and respective error bars were calculated on an hourly basis from measurements taken every 15 min.

