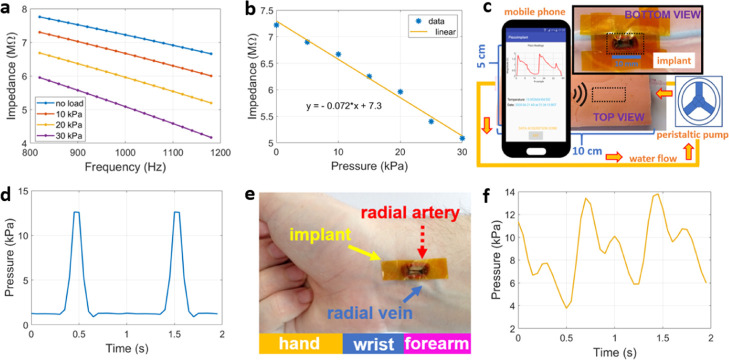
Figure 6.
(a) Impedance amplitude variation of the force sensor when actuated by different loads and centered around 1 kHz measured by a commercial impedance analyzer. (b) Linear fit relating impedance variation of the sensor with the applied load at 1 kHz. (c) Experimental setup developed for pressure monitoring by means of an anatomical phantom of the skin and subcutaneous tissues, with a circulation of water through the synthetic artery and implantable device placed on its walls (bottom view); the latter receiving the RF power from the opposite side of the phantom (top view). (d) Water pressure signal detected by the implantable device. (e) Location of the implantable device over the radial arterial (wrist). (f) Radial pressure signal displayed by the NFC-enabled mobile phone.

