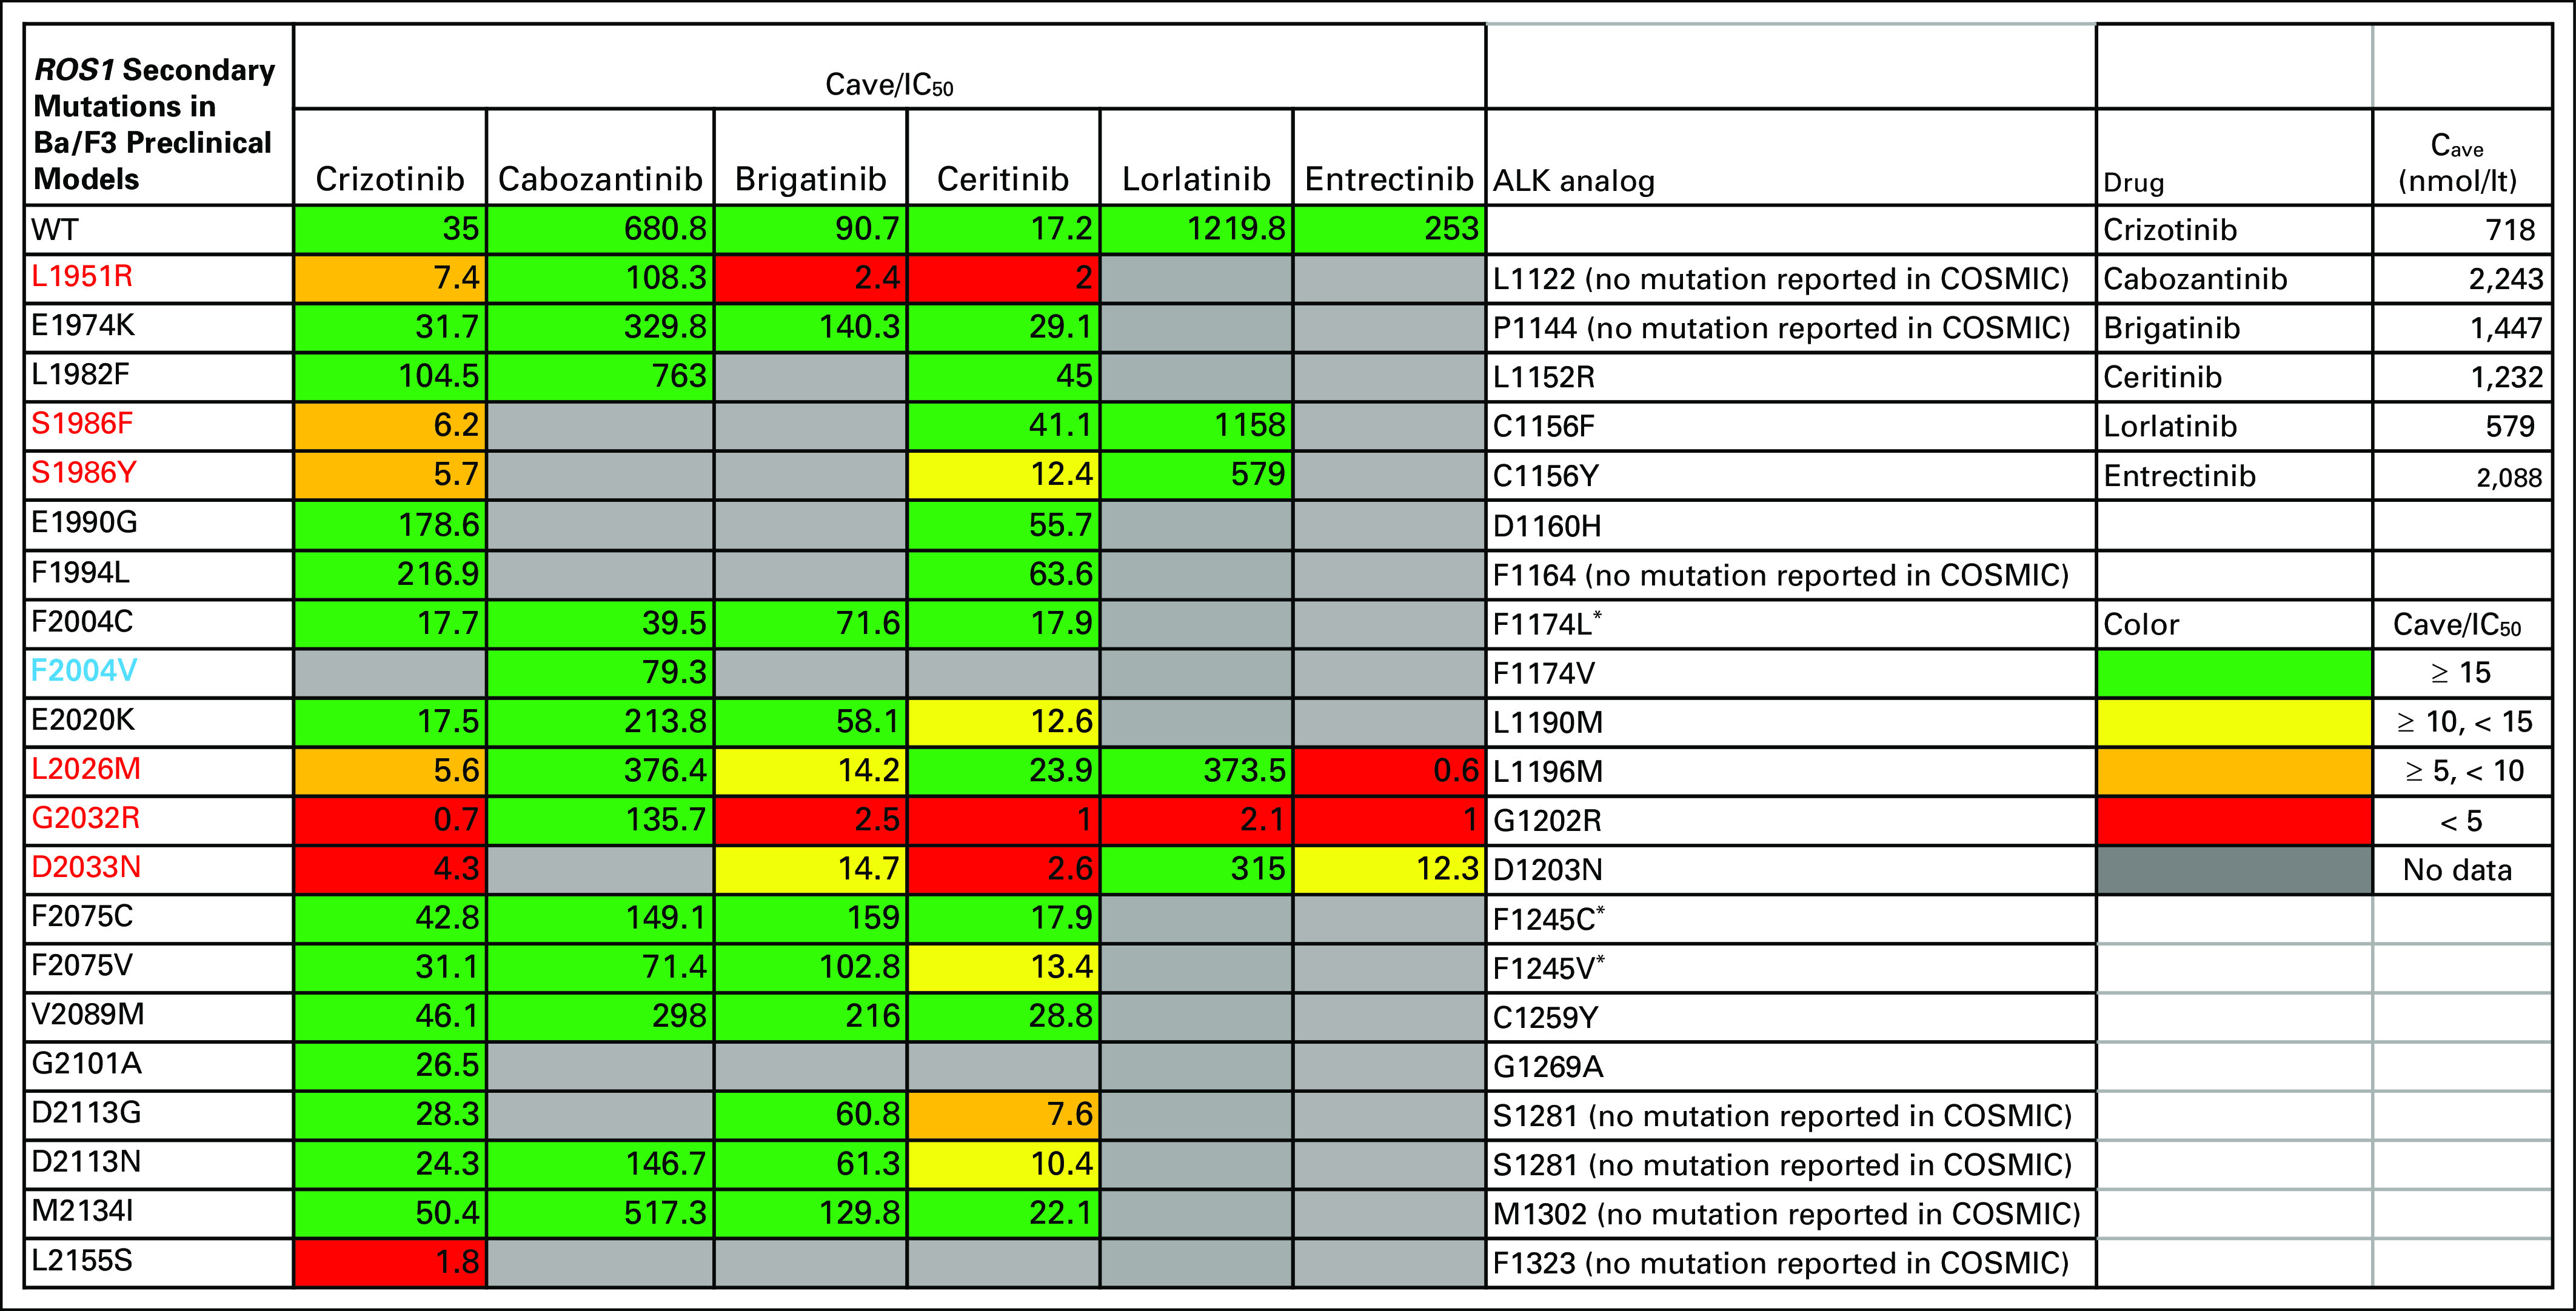
FIG 3.

Secondary mutations in ROS1 fusions reported in in vitro experiments in the literature and differential sensitivity to drugs with known ROS1 activity. The numbers in the boxes correspond to the average concentration (Cave) for the drug in steady state in patients, divided by the drug IC50 values calculated in Ba/F3 cells expressing the mutant ROS1 molecules. The half maximal inhibitory concentration (IC50) values were obtained from published reports. Colors represent relative potencies of the drugs compared with achievable drug exposure. The average IC50 was used if there was more than one publication for a certain mutation-drug combination. Repotrectinib is another potent ROS1 inhibitor with activity against many of these secondary mutations; it is not shown in the figure because the RP2D is not known yet for this drug.29 Cave values were calculated as the ratio of the area under the curve for 0 to 24 hours to 24 hours of the drug at steady state in patients.35,36 Secondary mutations that have been reported in clinical cases are highlighted in red and the ROS1 F2004V mutation described clinically for the first time in this report is highlighted in purple. The last column shows the homolog amino acid positions in ALK, estimated with the blastp program (https://blast.ncbi.nlm.nih.gov/Blast.cgi?PAGE=Proteins), and any ALK mutations at those positions reported in the literature or the Catalog of Somatic Mutations in Cancer (COSMIC) database. (*) These ALK mutations also are found in neuroblastoma.
