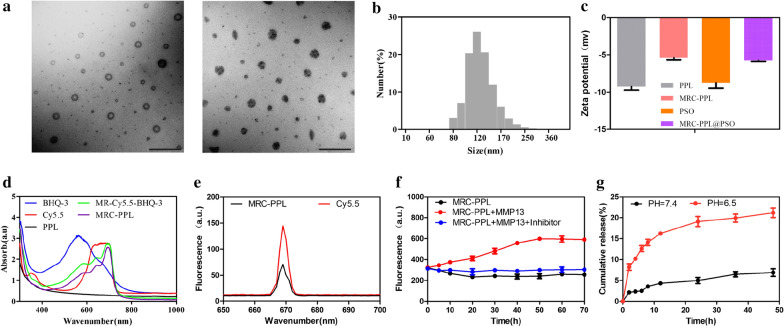
Fig. 2.
Characterization of MRC-PPL nano-micelles. a TEM images of MRC-PPL and MRC-PPL@PSO micelles. Scale bare = 500 nm. b Size distribution of MRC-PPL micelles based on dynamic light scattering. c Zeta potentials of PSO, PPL, MRC-PPL micelles and MRC-PPL@PSO micelles. d UV–Vis absorbance. e Fluorescence intensity of MRC-PPL micelles and Cy5.5. f Fluorescence intensity of MRC-PPL micelles, without or with MMP-13 (0.01 μM), in the absence or presence of MMP-13 inhibitor (0.45 μM). g In vitro release of PSO from MRC-PPL micelles in PBS (pH 6.5 and 7.4) with 0.1% Tween 80 (mean ± SD, n = 3)

