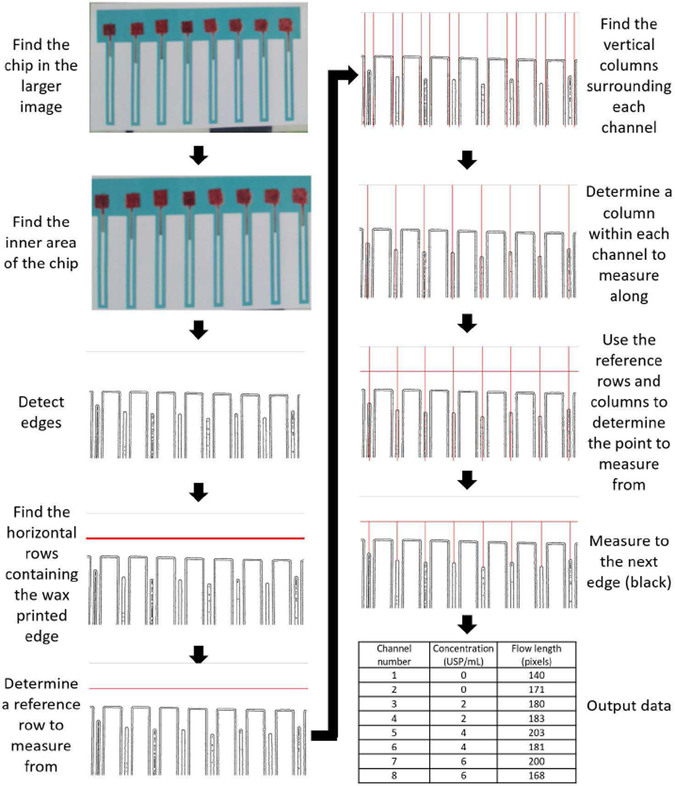
Fig. 3.
Automated image analysis procedure. The automated image analysis program finds the paper microfluidic chip within a larger image, then carries out contour detection and edge detection algorithms to find the wax printed borders and the edge of blood flow. Each channel is found and a horizontal reference point is determined based on the wax printed borders. The distance from the reference point to the edge of blood flow is measured for each channel.

