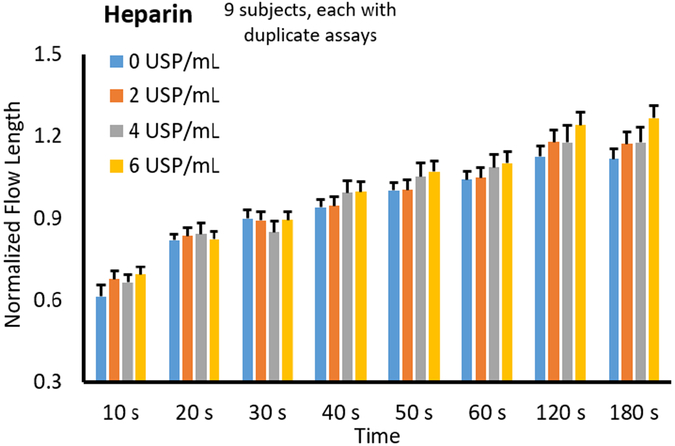
Fig. 6.
Automated image analysis with heparin. The flow lengths of the blood incubated with varied heparin concentrations on the sample pads, following automated image analysis, were plotted against the assay time, showing the smaller error bars than those with manual analysis (Fig. 4). The standard errors of the averages from 9 different subjects, each duplicated, were significantly decreased using automated image analysis versus manual image analysis by eliminating human error.

