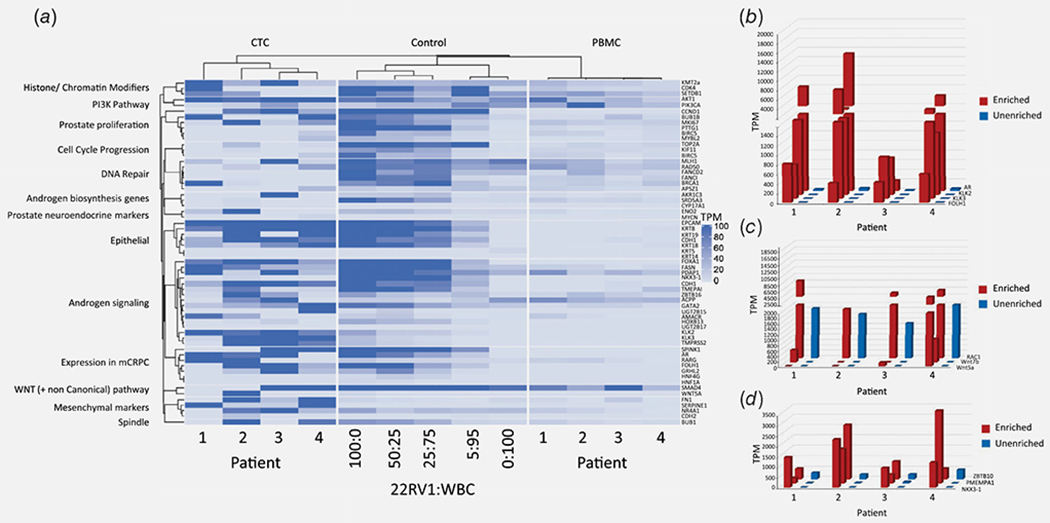
Figure 5.

Detection of PC-relevant genes. (a) Heat map representation comparing CTC-enriched, unenriched and engineered spike in controls for expression levels of PC-relevant genes arranged by function and/or pathway. (b–d) PC-relevant gene expression in CTC-enriched versus matched unenriched samples, focusing on examples of PC-specific genes (b), androgen signaling genes (c) and Wnt signaling genes (d). [Color figure can be viewed at wileyonlinelibrary.com]
