Abstract
NRXN1 undergoes extensive alternative splicing, and non-recurrent heterozygous deletions in NRXN1 are strongly associated with neuropsychiatric disorders. We establish that human induced pluripotent stem cell (hiPSC)-derived neurons represent well the diversity of NRXN1α alternative splicing observed in the human brain, cataloguing 123 high-confidence in-frame human NRXN1α isoforms. Patient-derived NRXN1+/− hiPSC-neurons show greater than two-fold reduction of half of the wild-type NRXN1α isoforms and express dozens of novel isoforms expressed from the mutant allele. Reduced neuronal activity in patient-derived NRXN1+/− hiPSC-neurons is ameliorated by overexpression of individual control isoforms in a genotype-dependent manner, whereas individual mutant isoforms decrease neuronal activity levels in control hiPSC-neurons. In a genotype-dependent manner, the phenotypic impact of patient-specific NRXN1+/− mutations can occur through a reduction in wild-type NRXN1α isoform levels as well as the presence of mutant NRXN1α isoforms.
Heterozygous exonic deletions in the Neurexin-1 gene (NRXN1, 2p16.3) are associated with neuropsychiatric disorders1 (schizophrenia (odds ratio = 14.4)2, autism spectrum disorder (odds ratio = 14.9)3, epilepsy (odds ratio = 9.91)4, and developmental delay/intellectual disability (odds ratio = 7.47)5). Deletions occur non-recurrently (with different boundaries) between patients2, and the mechanisms underlying variable penetrance and diverse clinical presentations remain unknown. Homozygous Nrxn1 knockout mice display behavioral (e.g. anxiety and social interaction) and electrophysiological (e.g. decreased mEPSCs)6–8 deficits, but only minor effects are observed in heterozygous mice. Engineered conditional heterozygous NRXN1+/− deletions in human induced pluripotent stem cell (hiPSC)-derived neurons impaired neurotransmitter release9. To better understand the clinical impact of NRXN1+/− mutations, it is critical to evaluate how distinct patient-specific deletions alter the NRXN1 isoform repertoire and impact synaptic function in a human context.
Mammals possess three neurexin genes (NRXN1, NRXN2 and NRXN3); each is highly alternatively spliced and can be expressed from three independent promoters to produce long alpha (NRXNα) isoforms and shorter beta (NRXNβ) and gamma (NRXNγ) isoforms. In humans, neurexins reach peak expression levels at birth10,11. Single molecule long-read RNA sequencing (RNA-seq) of mouse prefrontal cortex identified more than 200 Nrxn1α isoforms12,13; extensive Nrxn1 alternative splicing12,14 distinguishes neuronal cell types13,15 and is thought to recruit specific post-synaptic binding partners16.
We applied new methods17,18 to integrate targeted long- and short-read sequencing data, cataloguing and quantifying NRXN1α isoform repertoires in human postmortem brain and across hiPSC-neuronal subtypes. hiPSC-neurons derived from psychosis cases with heterozygous NRXN1 deletions exhibited significant perturbations in the NRXN1α isoform repertoire, including decreased levels of many wild-type isoforms and unexpected expression of patient-specific mutant NRXN1α isoforms. Single cell (sc) RNA-seq revealed that NRXN1+/− hiPSC-neurons failed to reach full maturity. Reduced neuronal activity in NRXN1+/− hiPSC-neurons could be ameliorated by overexpression of individual wild-type NRXN1α isoforms only in patient-derived hiPSC-neurons lacking expression of mutant isoforms, whereas neuronal activity was decreased in control hiPSC-neurons following expression of individual mutant NRXN1α isoforms, suggesting a possible novel dominant-negative mode of action for heterozygous NRXN1+/− mutations. In summary, we report and functionally evaluate psychiatric disease-associated changes in the NRXN1α isoform repertoire.
RESULTS
We generated hiPSCs from four individuals with rare heterozygous intragenic deletions in NRXN119,20 and diagnosed with a psychosis disorder (two sharing ~136-kb deletions in the 3’-region of NRXN1 and two sharing ~115-kb deletions in the 5’-region of NRXN1; available clinical information provided in Table 1) as well as one related and three unrelated age-, sex- and ethnicity-matched controls (Table 1, Fig. 1a, and Extended Data Fig. 1a–f). The 3’-NRXN1+/− deletions encompassed three exons, impacting canonical splice site 4 (SS4), thought to impact post-synaptic binding affinities21, but none of the other five known canonical splice sites. Two-to-three hiPSC clones per individual were reprogrammed from fibroblasts using a non-integrating sendai virus approach, followed by the differentiation of neural progenitor cells (NPCs) through dual SMAD inhibition22–24. NESTIN and SOX2-positive hiPSC-NPC populations robustly differentiated into MAP2-positive hiPSC-neurons (Fig. 1b), a forebrain-like population consisting primarily of glutamatergic neurons, but also GABAergic neurons and astrocytes25. hiPSC-NPCs were also rapidly induced into glutamatergic and GABAergic neurons through NGN2-26 and ASCL1/DLX2-induction27, respectively.
Table 1 |.
Clinical information for the hiPSC cohort used in this study
| Patient ID | Family | Sex | Diagnosis | Age of onset | IQ | CNV burden | Start (hg19) | Stop (hg19) | Size (kb) | Type | PRS | Ancestry |
|---|---|---|---|---|---|---|---|---|---|---|---|---|
| 553 | N/A | M | Control | N/A | 127 | − | − | − | − | − | −0.0003012 | European |
| 2607 | N/A | M | Control | N/A | 126 | − | − | − | − | − | −0.0003791 | European |
| 3084 | N/A | M | Control | N/A | 87 | − | − | − | − | − | −0.0001327 | Non-European |
| 642 | Mother 1 | F | Paranoid PD | 17 | N/A | − | − | − | − | − | −0.000333 | European |
| 973 | Proband 2 | M | COBD + psychosis | 8 | 89 | 2p16.3 del | 51,190,677 | 51,306,133 | 115.456 | 5’ NRXN1+/− | −0.0001820 | Non-European |
| 972 | Mother 2 | F | BD + psychosis | unknown | MR | 2p16.3 del | 51,190,677 | 51,306,133 | 115.456 | 5’ NRXN1+/− | −0.0001633 | Non-European |
| 581 | Proband 1 | M | COS | 7 | 74 | 2p16.3 del | 50,162,758 | 50,298,963 | 136.205 | 3’ NRXN1+/− | −0.000360 | European |
| 641 | MZ twin 1 | M | SA | <14 | N/A | 2p16.3 del | 50,162,758 | 50,298,963 | 136.205 | 3’ NRXN1+/− | −0.0003620 | European |
IQ, intelligence quotient; CNV, copy number variant; M, male; F, female; MZ, monozygotic; PD, personality disorder; COBD, childhood-onset bipolar disorder; BD, bipolar disorder; COS, childhood-onset schizophrenia; SA, schizoaffective disorder; del, deletion.
Figure 1 |. Cohort description and transcriptomic analysis.
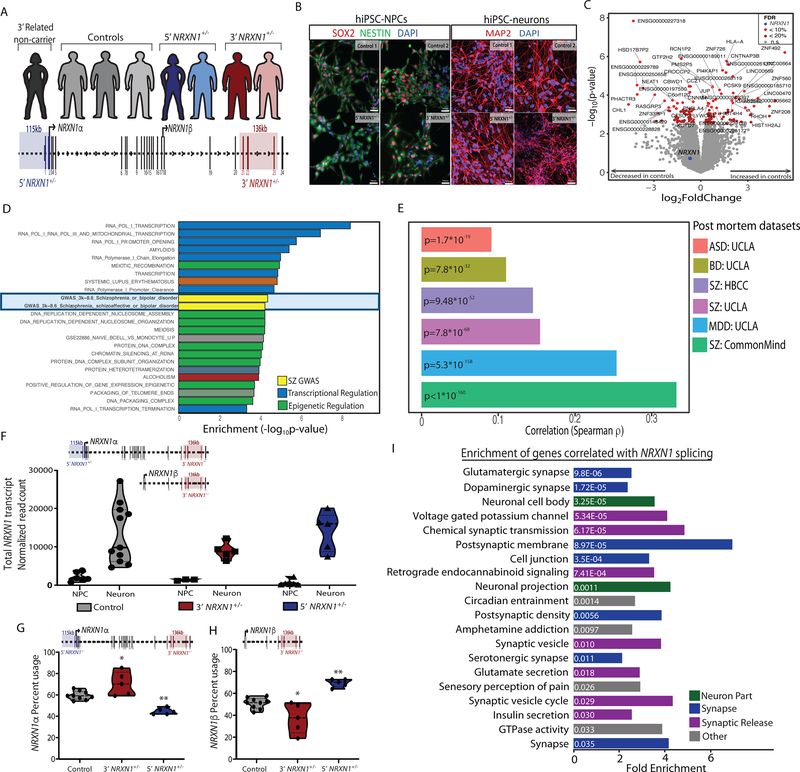
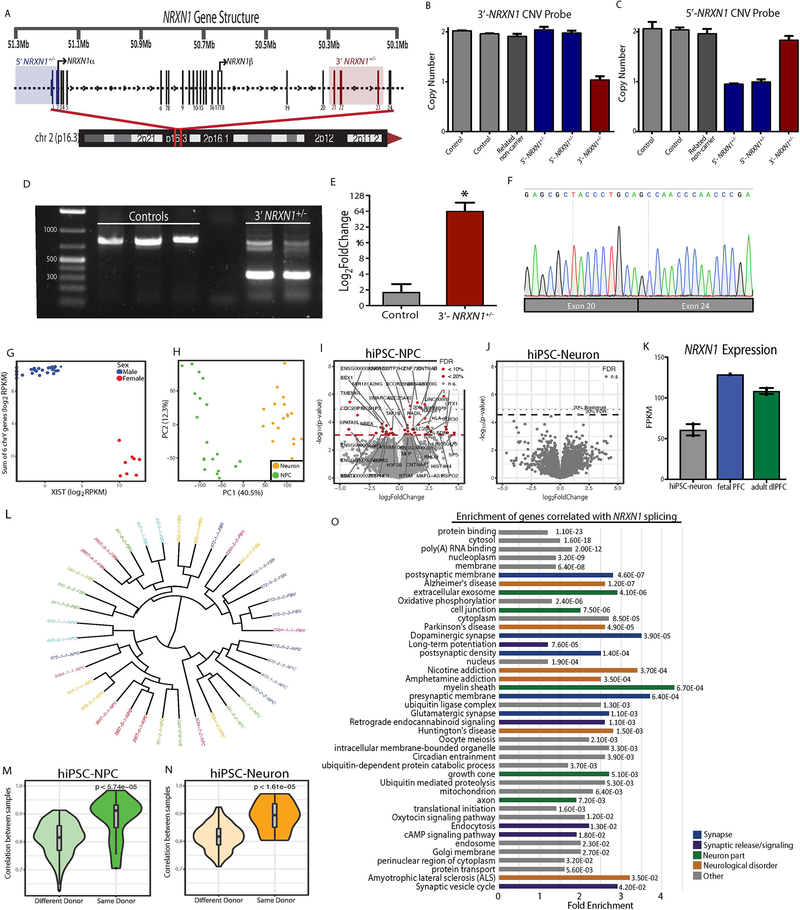
a, Representation of individuals in the hiPSC cohort used for this study (5’-NRXN1+/− deletions in blue; 3’-NRXN1+/− deletions in red; controls in gray) with schematic of the NRXN1 gene structure highlighting the exons encompassed by 5’-(blue) and 3’-(red) NRXN1+/− deletions. b, Validation of hiPSC-derived neural cells by immunostaining for SOX2 and NESTIN (NPCs) and MAP2 (6-week hiPSC-neurons) with DAPI stained nuclei, 3 independent differentiations per line. c, Volcano plot showing log2(foldchange) between NRXN1+/− (18 samples, 4 donors) and controls (19 samples, 4 donors) and the –log10(P-value) by linear model for each gene with FDR < 20% in red, FDR < 10% in orange and NRXN1 in blue. d, Gene set enrichment analysis, with –log10(P-value) computed by Fisher Exact test using mSigDB68. e, Concordance computed using Spearman correlation of the t-statistics between two datasets. Comparisons were made between this study and postmortem RNA-seq datasets of schizophrenia (SZ), major depressive disorder (MDD), bipolar disorder (BD), and autism spectrum disorder (ASD) from CommonMind33, NIMH HBCC and UCLA69. f, Sum of all NRXN1 transcript expression by cell type (19 samples, 8 donors hiPSC-NPC; 18 samples, 8 donors hiPSC-neurons) and genotype (19 samples, 4 donors controls; 10 samples, 2 donors 5’-NRXN1+/−; 8 samples, 3 donors 3’-NRXN1+/−). g,h, Differential isoform usage in hiPSC-neurons across genotypes (9 samples, 3 donors controls; 5 samples, 2 donors 5’-NRXN1+/−; 5 samples, 2 donors 3’-NRXN1+/−) when sub-setting for NRXN1α isoforms (g) or NRXN1β isoforms (h). Violin plots display median and quartiles (*P < 0.05, **P < 0.01 by one-way ANOVA with Dunnett’s Test). i, Gene set enrichments for genes correlated with NRXN1 spicing in hiPSC-neurons.
NRXN1+/− hiPSC-neurons display aberrant NRXN1 isoform expression
To survey the molecular impact of patient-specific NRXN1+/− deletions, we performed whole transcriptome RNA-seq on hiPSC-NPCs and 6-week hiPSC-neurons from two-to-three hiPSC clones per individual (Supplementary Table 1). Following confirmation of sample identity24 and cell type composition (Extended Data Figs. 1 and 2), we analyzed 37 hiPSC-NPC and hiPSC-neuron samples. In the combined dataset, differential expression (DE) analysis between NRXN1+/− and controls identified 49 genes with FDR < 10% and 148 genes with an FDR < 20%, when controlling for cell type as a covariate24 (Fig. 1c and Supplementary Tables 2–4). DE genes were enriched for schizophrenia GWAS-associated genes and transcriptional/epigenetic regulation gene sets (Fig. 1d and Supplementary Table 5). This could reflect perturbations downstream of NRXN1+/− and/or the independent contribution of other schizophrenia risk variants. Although functions associated with common variants in ASD exhibit enhanced effects when found in combination with rare variant(s)28, and genetic risk underlying many neuropsychiatric disorders is thought to converge at pathways involved in synaptic function2,29–31 and epigenetic regulation31,32, our cohort is underpowered to examine this question in greater detail. We observed a significant correlation between the overall t-statistics from our case-control NRXN1+/− hiPSC-NPC/neuron comparison with postmortem brain comparisons of schizophrenia, major depressive disorder, bipolar disorder, and autism spectrum disorder (CommonMind33, NIMH HBCC and UCLA datasets34) (Fig. 1e and Supplementary Table 6). This enrichment for GWAS-linked genes and correlation with postmortem datasets highlighted that patient-specific NRXN1+/− neurons captured some of the biological underpinnings associated more broadly with psychiatric disease35.
Total NRXN1 levels were significantly greater in hiPSC-neurons than hiPSC-NPCs (Fig. 1f; log2FC = 3.03, Padj = 2.08 × 10⁻⁸ by linear model). Although total NRXN1 gene expression was not significantly decreased in NRXN1+/− hiPSC-NPCs or hiPSC-neurons compared to controls (Fig. 1f), we queried if the expression of NRXN1α or NRXN1β isoforms shifts between control, 5’- and 3’-NRXN1+/− hiPSC-neurons. Consistent with differential promoter usage, 5’-NRXN1+/− hiPSC-neurons showed a decrease in NRXN1α isoforms (Fig. 1g; P = 0.001 by one-way ANOVA with Dunnett’s test), while NRXN1β isoforms were significantly increased (Fig. 1h; P = 0.001 by one-way ANOVA with Dunnett’s test). Alternatively, 3’-NRXN1+/− hiPSC-neurons demonstrated a more subtle increase in NRXN1α isoform usage (Fig. 1g; P = 0.01 by one-way ANOVA with Dunnett’s test), while usage of NRXN1β isoforms were decreased (Fig. 1h; P = 0.01 by one-way ANOVA with Dunnett’s test).
NRXN1 exon expression is highly correlated with its own gene expression; therefore, to identify genes associated with NRXN1 splicing, we calculated partial correlation coefficients between all genes and each NRXN1 exon (irrespective of genotype), adjusting for NRXN1 gene transcription. Genes with significant correlation coefficients (FDR < 0.01) to perturbations in NRXN1α splicing in hiPSC neurons (regardless of NRXN1 gene expression) were enriched for synaptic gene sets (Fig. 1i). Similar results were observed in postmortem adult brains33 (Extended Data Fig. 1o), in donors lacking rare NRXN1+/− deletions, suggesting a generalizable correlation between NRXN1 splicing patterns and global expression of synaptic genes.
Because isoform quantification by short-read RNA-seq is limited36 and current annotations do not include all possible NRXN1 isoforms, such as potentially novel isoforms arising from the deletion allele, we developed a targeted hybrid sequencing approach to more carefully examine the impact of patient-specific deletions in NRXN1 on isoform expression.
Many NRXN1α isoforms are conserved between fetal prefrontal cortex and hiPSC-neurons
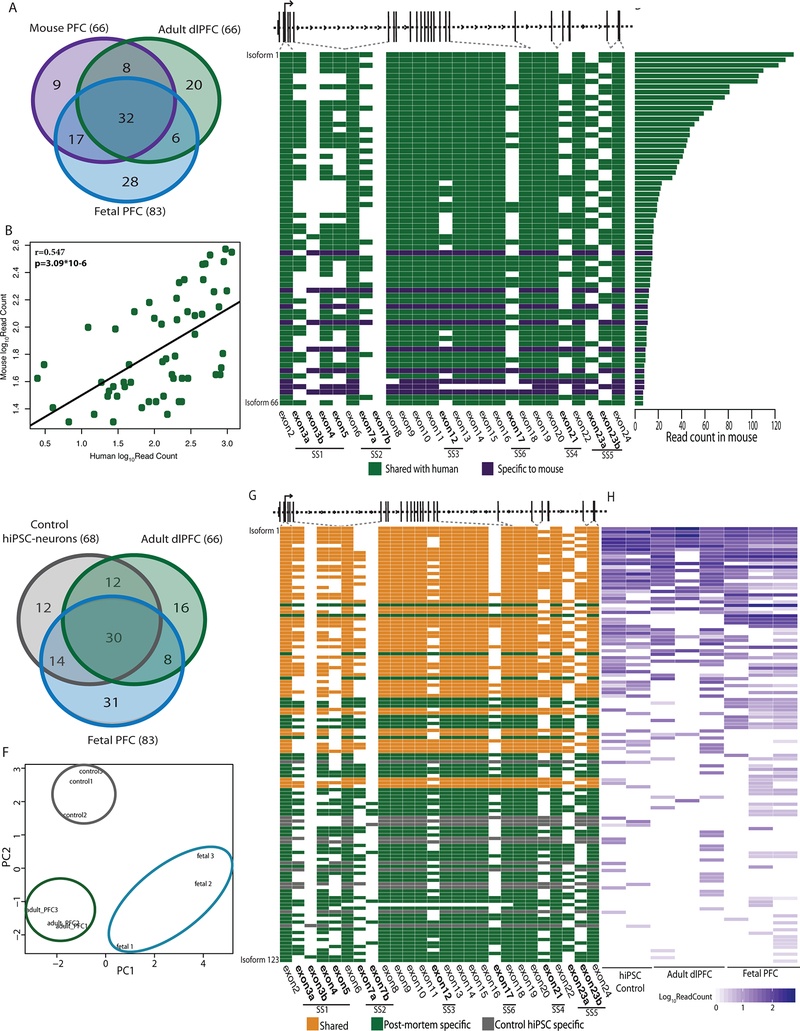
Targeted single molecule real-time (SMRT) Iso-seq of mouse prefrontal cortex (PFC) previously identified 247 Nrxn1α isoforms12. Our hybrid approach integrated long-read Iso-seq (Pacific Biosciences) with short-read amplicon sequencing (Illumina), quantifying NRXN1α isoforms across three human fetal PFC, three adult dorsal lateral prefrontal cortex (dlPFC) and one mouse PFC12 sample (Fig. 2a–d, Extended Data Figs. 3 and 4, and Supplementary Tables 7–10). A read-count threshold (≥7) filtered potentially spurious low abundant isoforms (Extended Data Fig. 4 and Supplementary Note). The NRXN1α isoforms identified in human samples recapitulated 86% of the isoforms detected in mouse (Fig. 2a). Levels of shared mouse-human NRXN1α isoforms were significantly correlated (Fig. 2b; r = 0.574, P = 3.09 × 10⁻⁶), with the most abundant isoforms best conserved between species (Fig. 2c,d). Mouse-specific Nrxn1α isoforms also revealed SS3 to SS6 splicing not seen in the human dataset (Fig. 2c,d).
Figure 2 |. Conservation of NRXN1α isoforms across mouse PFC, postmortem PFC and hiPSC-neurons.
a, Overlap of NRXN1α isoforms identified in mouse PFC (1 sample), adult dlPFC (3 donors) and fetal PFC (3 donors). b, Pearson’s correlation of the abundance of 57 NRXN1α isoforms shared between mouse (1 sample) and human (7 samples) with two-sized t-test. c, Schematic of NRXN1α isoform structure, with each row representing a unique NRXN1α isoform and each column representing a NRXN1α exon. Colored exons (green, shared; purple, mouse specific) are spliced into the transcript while blank exons are spliced out. d, Read count for each NRXN1α isoform in mouse PFC. e, Overlap of NRXN1α isoforms identified in adult dlPFC (3 donors), fetal PFC (3 donors) and control hiPSC-neurons (2 donors). f, PCA of NRXN1α isoforms across adult postmortem (3 donors), fetal postmortem (3 donors) and hiPSC-neuron samples (3 donors). g, Schematic of NRXN1α isoform structure, with each row representing a unique NRXN1α isoform and each column representing a NRXN1 exon. Colored exons (orange, shared; green, postmortem specific; gray, hiPSC-neuron specific) are spliced into the transcript while blank exons are spliced out. h, Abundance of each NRXN1α isoform by sample.
We catalogued 123 human NRXN1α isoforms (predicted to be translated, ≥7 read-count threshold) across two control hiPSC-neuron, three adult dlPFC and three fetal PFC samples. Fetal PFC exhibited the highest NRXN1 expression (whole transcriptome sequencing: Extended Data Fig. 1k) and the greatest NRXN1α isoform diversity (targeted hybrid analysis: fetal PFC (n = 83), adult dlPFC (n = 66) and hiPSC-neurons (n = 68); Fig. 2e–f and Supplementary Table 7). Overall, hiPSC-neurons modeled well the NRXN1α alternative splicing diversity found in vivo, particularly the high abundance isoforms (Fig. 2g,h).
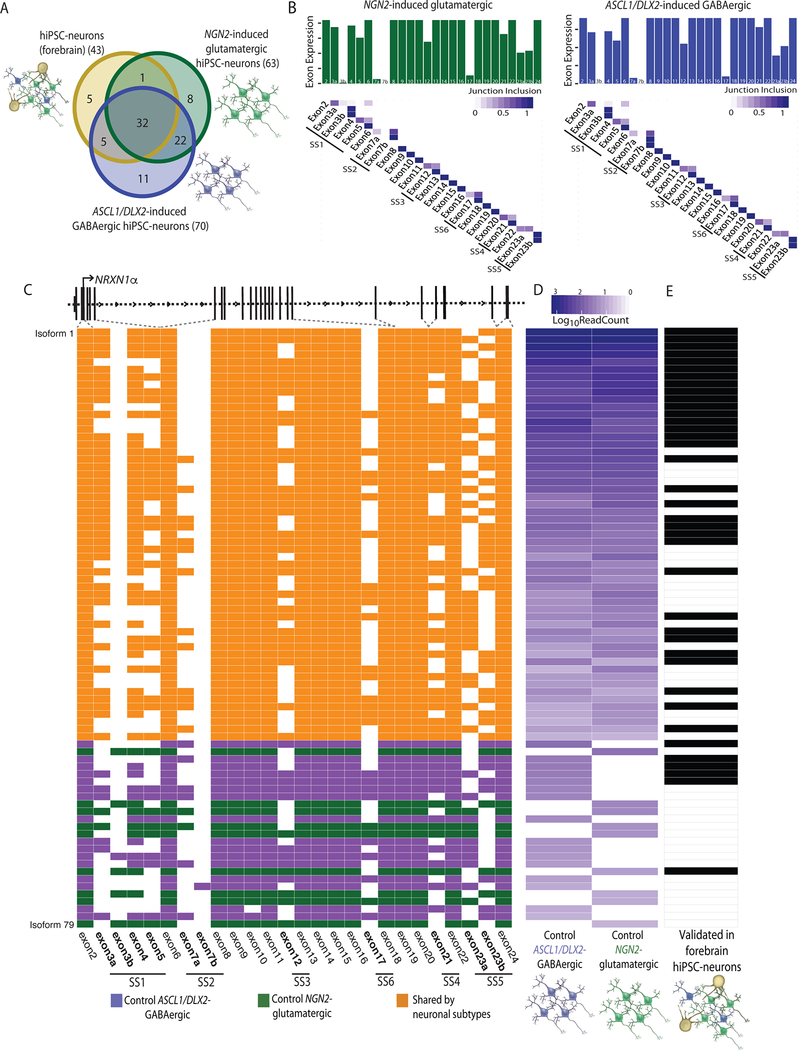
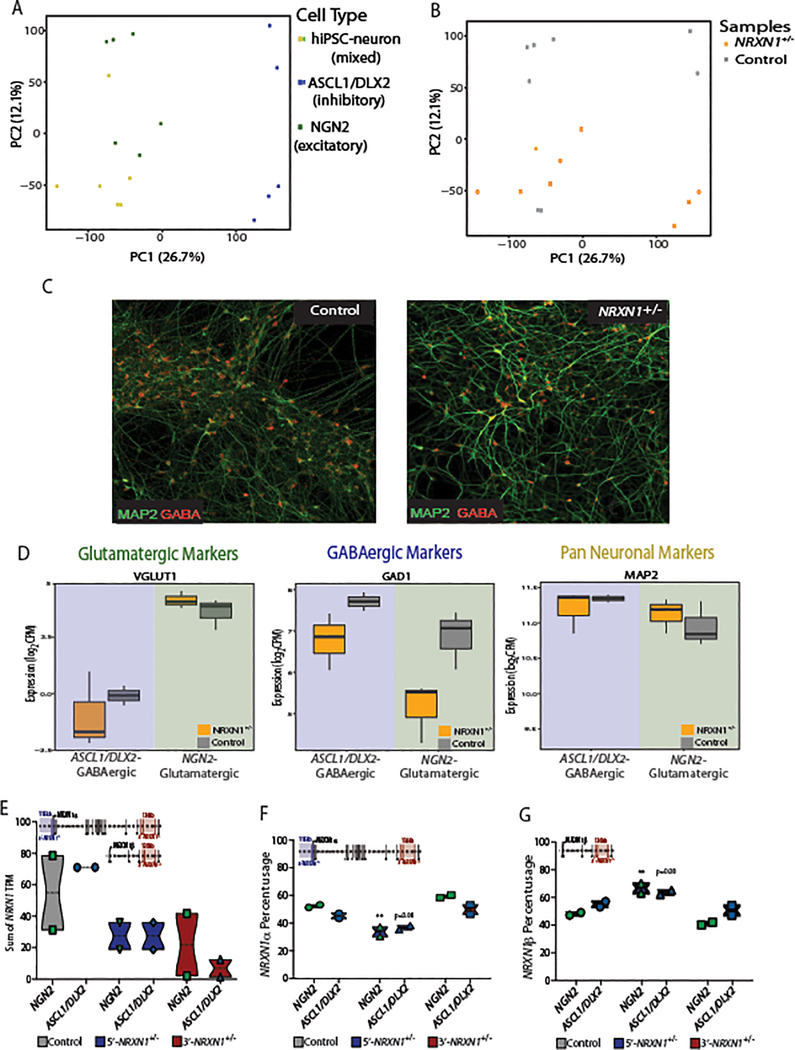
Nrxn1α isoforms differ between glutamatergic and GABAergic neurons in mice12,14,15; therefore, we queried induced NGN2-glutamatergic neurons and ASCL1/DLX2-GABAergic neurons (Extended Data Fig. 5a–d). Whole transcriptome RNA-seq revealed a significant decrease in total NRXN1 expression in NRXN1+/− NGN2-glutamatergic hiPSC-neurons37,38 and ASCL1/DLX2-GABAergic hiPSC-neurons27 compared to controls (Extended Data Fig. 5e), a finding not seen in our forebrain hiPSC-neurons (Fig. 1f), but similar shifts in NRXN1α/β isoform usage (particularly decreased NRXN1α and increased NRXN1β in 5’-NRXN1+/− hiPSC-neurons) were detected (Fig. 1g,h and Extended Data Fig. 5f,g). Forebrain hiPSC-neurons showed less NRXN1α diversity (n = 43) compared to isogenic NGN2-glutamatergic neurons (n = 63) and ASCL1/DLX2-GABAergic neurons (n = 70) by targeted hybrid sequencing (Fig. 3a). Of the NRXN1α isoforms identified in forebrain hiPSC-neurons, 74% were also detected in both NGN2-glutamatergic and ASCL1/DLX2-GABAergic neurons, and 88% were shared with at least one, suggesting almost no additional contribution of glial cells to NRXN1α diversity. Exon expression and junction inclusion values were similar between induced glutamatergic and GABAergic neuronal subtypes (Fig. 3b,c), with 22 NRXN1α isoforms (~31% of ASCL1/DLX2-GABAergic and 35% of NGN2-glutamatergic NRXN1α isoforms) shared between subtypes, but not detected within the forebrain hiPSC-neurons (Fig. 3c–e). Induced neurons (3-week-old NGN2-glutamatergic and 5-week-old ASCL1/DLX2-GABAergic) may achieve levels of electrophysiological maturity that exceed that of differentiated (6-week-old hiPSC forebrain) counterparts; if true, differences in baseline population-level maturity in vitro may be masking larger cell-type specific effects detectable between mature neurons of the human brain.
Figure 3 |. Identification of cell type specific NRXN1 isoforms from control isogenic hiPSC-neuronal subtypes.
a, Overlap of NRXN1α isoforms identified in forebrain hiPSC-neurons (3 donors), NGN2-glutamatergic hiPSC-neurons (1 donor) and ASCL1/DLX2-GABAergic hiPSC-neurons (1 donor). b, Bar plot of the total read count for each NRXN1α exon along with the fraction that each NRXN1α junction (row, 5’ end; column, 3’ end) is included in control NGN2-glutamatergic hiPSC-neurons (green, left) and control ASCL1/DLX2-GABAergic hiPSC-neurons (blue, right). c, Schematic of NRXN1α isoform structure, with each row representing a unique NRXN1α isoform and each column representing a NRXN1 exon. Colored exons (blue, ASCL1/DLX2-GABAergic specific, green, NGN2-glutamatergic specific; orange, shared) are spliced into the transcript while blank exons are spliced out. d, Abundance of each NRXN1α isoform across control isogenic hiPSC-neuronal subtypes. e, Validation of each isoform in control forebrain hiPSC-neurons (black, expressed).
NRXN1α isoforms are differentially expressed in NRXN1+/− hiPSC-neurons
We next quantified NRXN1α isoforms in patient-specific 3’-NRXN1+/− neurons (Extended Data Figs. 3 and 4); because this targeted strategy relied upon the amplification of transcripts containing the first and last coding exons of NRXN1α (Supplementary Note and Extended Data Fig. 3a), it was unsuitable for the two 5’-NRXN1+/− cases, whose deletion encompassed the first coding exon. The correlation of NRXN1α isoform expression was higher between the two 3’-NRXN1+/− cases (r = 0.59) or between the two controls (r = 0.60) than across NRXN1 genotypes (r = 0.03–0.37) (Extended Data Fig. 6a).
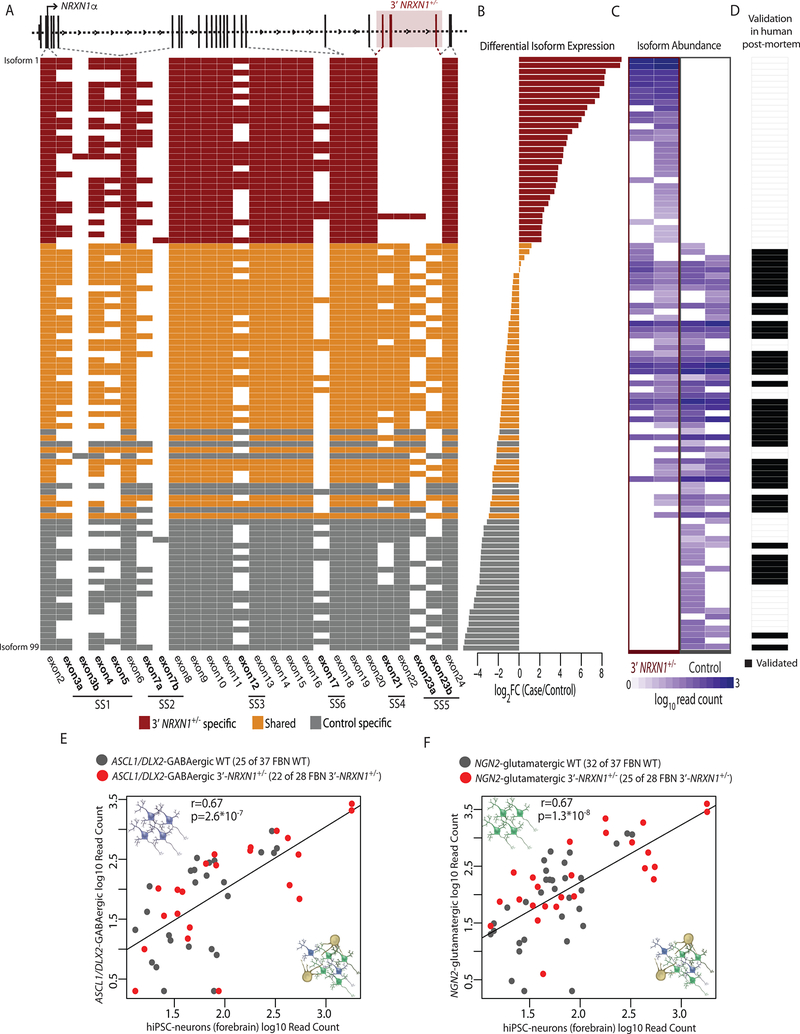
Across two 3’-NRXN1+/− cases (relative to two controls), we observed reduced abundance of 49 of 99 (50%) wild-type isoforms (fold change < −2; FDR < 0.01) (Fig. 4a–c and Supplementary Table 11). We further detected 31 mutant NRXN1α isoforms unique to 3’-NRXN1+/− hiPSC-neurons that resulted from splicing across the three deleted exons (Extended Data Fig. 1d), and never detected in control hiPSC-neurons or postmortem samples (Fig. 4a–d). Mutant isoforms were confirmed in 3’-NRXN1+/− NGN2-glutamatergic and ASCL1/DLX2-GABAergic hiPSC-neurons (Fig. 4e,f). The novel junction site was validated through Sanger sequencing of TOPO-cloned isoforms (Extended Data Fig. 1f), RT-PCR across the 3’-NRXN1+/− deletion (Extended Data Fig. 1d) and qPCR (Extended Data Fig. 1e). All catalogued isoforms, including the mutant isoforms, were predicted to be translated; translation of a 3xFLAG-tagged mutant NRXN1α isoform was confirmed by western blot (Extended Data Fig. 8q).
Figure 4 |. Identification of mutant NRXN1α isoforms.
a, Schematic of NRXN1α isoform structure, with each row representing a unique NRXN1α isoform and each column representing a NRXN1 exon. Colored exons (red, 3’-NRXN1+/− specific; gray, control specific; orange, shared) are spliced into the transcript while blank exons are spliced out. b, log2(foldchange) of each NRXN1α isoform in 3’-NRXN1+/− hiPSC-neurons (2 donors) compared to control hiPSC-neurons (2 donors). c, Abundance of each NRXN1α isoform across 3’-NRXN1+/− and control hiPSC-neurons. d, Validation of each isoform in postmortem samples (black, expressed in postmortem PFC). e, Pearson’s correlation of 47 NRXN1α isoforms between hiPSC-neurons (forebrain) and ASCL1/DLX2-GABAergic neurons from 3’-NRXN1+/− (1 donor) and controls (1 donor) with two-sized t-test. f, Pearson’s correlation of 57 NRXN1α isoforms between hiPSC-neurons (forebrain) and NGN2-glutamatergic neurons from 3’-NRXN1+/− (1 donor) and controls (1 donor) with two-sized t-test.
Across control and 3’-NRXN1+/− hiPSC-neurons, alternative splicing of NRXN1α occurred at the six previously annotated canonical splice sites, with almost no occurrences of non-canonical splicing (Extended Data Fig. 6b,c). In fact, there was very similar inclusion of all NRXN1α exons between control hiPSC-neurons and 3’-NRXN1+/− hiPSC-neurons, except for those exons encompassed by the 3’-deletion (Extended Data Fig. 6c). Overall, the 3’-NRXN1+/− deletion impacted the NRXN1α transcriptional repertoire by decreasing levels of wild-type isoforms and also by introducing novel isoforms not otherwise identified in control hiPSC-neurons or in postmortem brain.
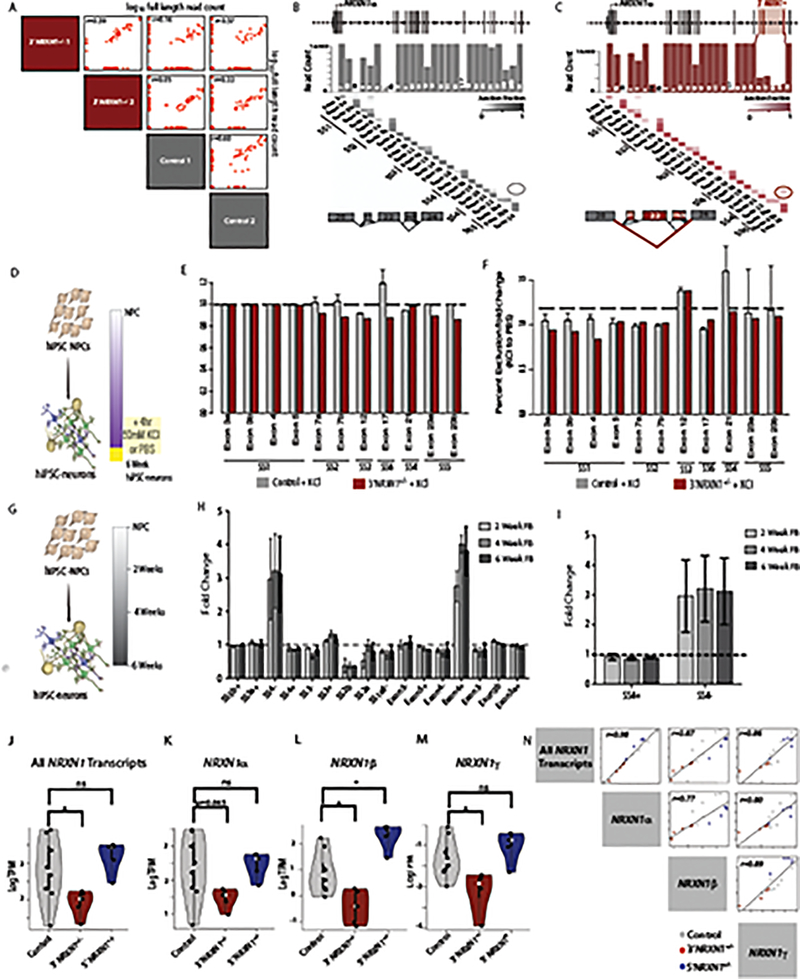
To consider any transcripts generated by alternative start or stop sites, we leveraged our whole-transcriptome RNA-seq data from hiPSC-neurons across NRXN1 genotypes (control, 5’- and 3-NRXN1+/− deletions), to quantify the total levels of NRXN1α, NRXN1β and NRXN1γ primary isoforms (Extended Data Fig. 6j). This unbiased approach revealed significantly decreased NRXN1 expression in 3’-NRXN1+/− hiPSC neurons and increased overall expression of NRXN1β in 5’-NRXN1+/− hiPSC-neurons (Extended Data Fig. 6k–m). The consistent change in mRNA expression levels of the NRXN1α, NRXN1β, and NRXN1γ isoforms in 5’- and 3’-NRXN1+/− hiPSC-neurons suggested there was no compensation of mRNA expression across isoform groups (Extended Data Fig. 6n).
Perturbed neuronal maturation of NRXN1+/− hiPSC-neurons
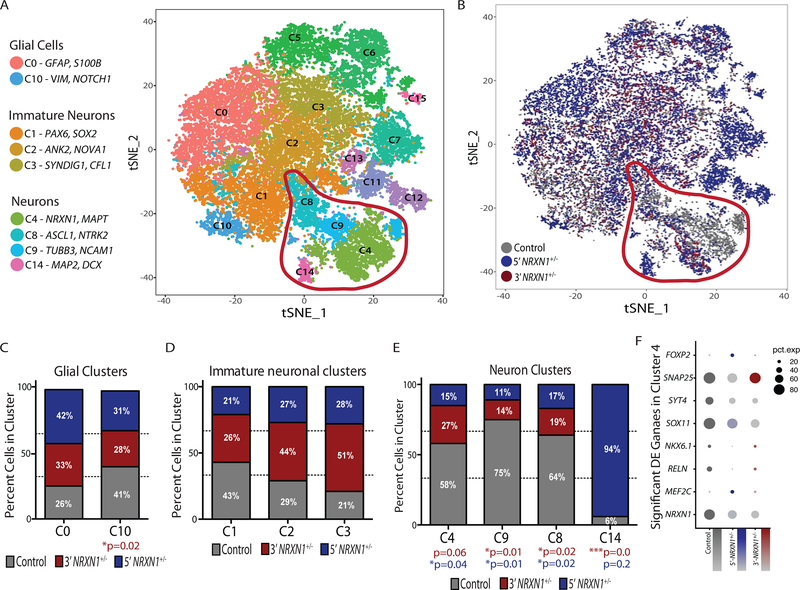
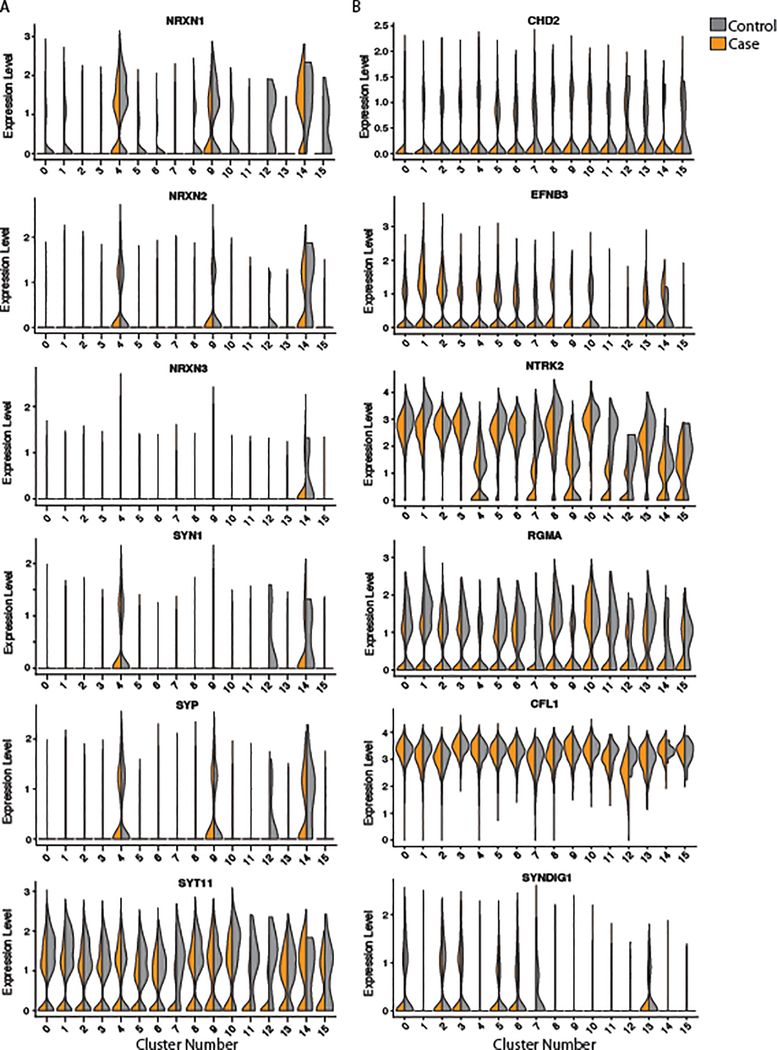
We examined the extent to which aberrant isoform expression in NRXN1+/− neurons impacted neuronal differentiation. Although a small number of samples were considered, by focusing on the distribution across different cell types, rather than across case/control samples, integrated analysis of scRNA-seq from two control and three NRXN1+/− hiPSC-forebrain neurons (Supplementary Table 12) revealed a dramatic shift in cell type composition. NRXN1+/− cells were under-represented in the mature neuron clusters C4 (3’-NRXN1+/− P = 0.06; 5’-NRXN1+/− P = 0.04), C8 (3’-NRXN1+/− P = 0.02; 5’-NRXN1+/− P = 0.02) and C9 (3’-NRXN1+/− P = 0.01; 5’-NRXN1+/− P = 0.01). These clusters exhibited the highest NRXN1 expression (Fig. 5a,e) and were distinguished by mature neuronal marker genes including MAPT, MAP2, and TUBB3 (Supplementary Tables 13 and 14). Interestingly, C14, a mature neuronal cluster, was also identified and contained almost exclusively 5’-NRXN1+/− hiPSC-neurons (Fig. 5a,b,e). Conversely, the clusters (C0, C10) with highest expression of astrocyte markers, including GFAP and s100B (Supplementary Tables 13 and 14), along with the more immature neuronal clusters (C1, C2, and C3), were equally comprised of control and NRXN1+/− cells (Fig. 5d,e). We found no dramatic differences in the expression level and percent of cells expressing common synaptic markers in the immature neuronal clusters (Extended Data Fig. 7) or impact on the relative patterning of glutamatergic, GABAergic or glial fates by scRNA-seq (Fig. 5a–e) or immunocytochemical analysis (Extended Data Fig. 2c,d). Within the largest and most mature neuron cluster (C4), patient NRXN1+/− neurons showed significantly reduced expression of NRXN1 (Padj = 3.07 × 10⁻²⁴), as well as genes related to the development of the nervous system, development of axons and neuronal projection regulation, and regional patterning (Fig. 5f and Supplementary Table 15).
Figure 5 |. Single-cell sequencing of hiPSC-neurons.
a, tSNE plot of 15 clusters identified in combined Seurat analysis of hiPSC-neuron samples from 5 donors (control (2), 5’-NRXN1+/− (2) and 3’-NRXN1+/−(1)) and marker genes of relevant clusters. b, tSNE plot colored by NRXN1 genotype (control (2), 5’-NRXN1+/− (2) and 3’-NRXN1+/−(1)). c-e, Percent cells from each genotype (control (2), 5’-NRXN1+/− (2) and 3’-NRXN1+/−(1)) across 2 glial clusters (c), 3 immature neuronal clusters (d) and 4 neuron clusters (e). f, Differentially expressed genes by linear model between NRXN1+/− hiPSC-neurons and controls within C4, the most mature neuronal cluster.
NRXN1+/− hiPSC-neurons exhibit deficits in neuronal activity
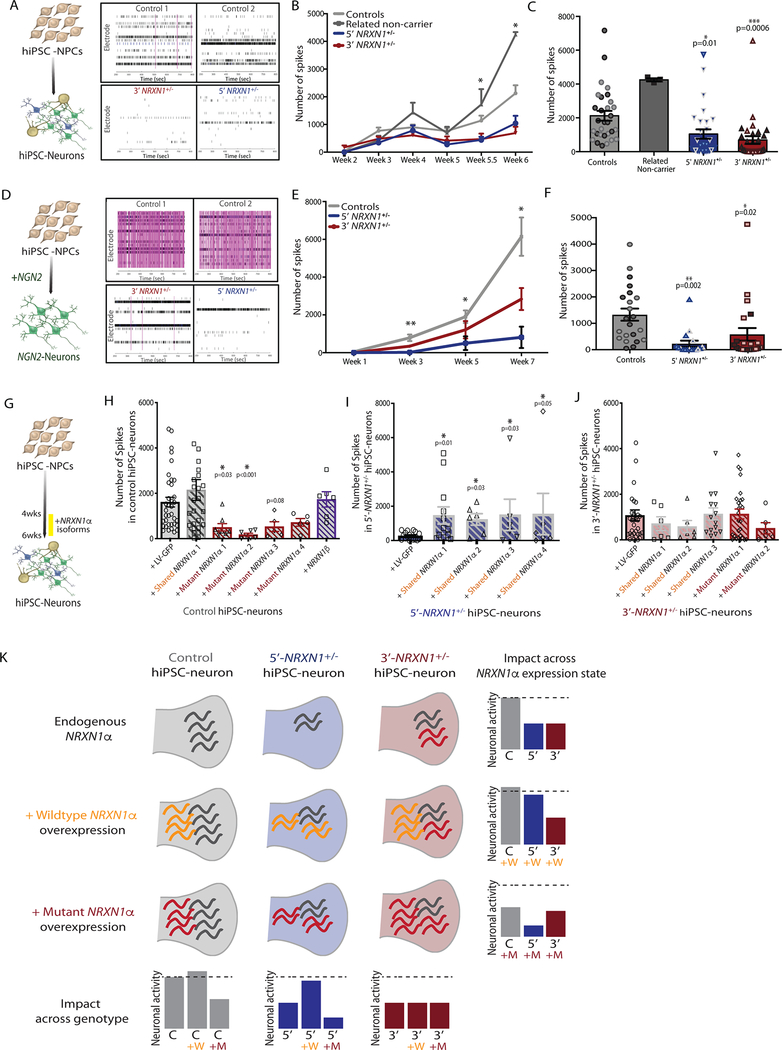
The impact of NRXN1+/− deletions on population-wide neuronal activity was evaluated across all four cases (both 5’- and 3’-NRXN1+/− carriers), relative to two or three control donors in each experiment, using two independent methods of generating neurons. In more slowly maturing forebrain hiPSC-neurons, weekly recordings of spontaneous action potentials demonstrated a decrease in the number of spikes after 6 weeks of differentiation (Fig. 6a–c, 5’-NRXN1+/− P = 0.01; 3’-NRXN1+/− P = 0.0006 by one-way ANOVA with Dunnett’s test) with no change in the number of SYN1-positive puncta (Extended Data Fig. 2e,f). These findings were confirmed in NGN2-glutamatergic hiPSC-neurons, which also exhibited decreased spikes at 3 weeks and through 7 weeks of maturation into induced neurons from all four cases (Fig. 6d–f, 5’-NRXN1+/− P = 0.002; 3’-NRXN1+/− P = 0.02 by one-way ANOVA with Dunnett’s test).
Figure 6 |. Impact of specific NRXN1α isoforms on neuronal activity.
a-c, Results of hiPSC-neuron (forebrain) multi-electrode array (MEA) showing representative raster plot for each genotype (a), a time-course of spontaneous activity over two independent 6-week differentiations (b), and quantification of the number of spontaneous spikes at 6-weeks across controls (30 wells, 2 donors), related non-carrier (3 wells, 1 donor), 5’-NRXN1+/− (30 wells, 2 donors), 3’-NRXN1+/− (30 wells, 2 donors) (c). d-f, Results of NGN2-neuron MEA showing representative raster plots for each genotype (d), a time-course of spontaneous activity over 7-weeks of two independent differentiations (e) and quantification of number of spontaneous spikes at 6-weeks across controls (22 wells, 2 donors), 5’-NRXN1+/− (22 wells, 2 donors), 3’-NRXN1+/− (17 wells, 2 donors) (f). Two unique donors per genotype indicated by different shading within each plot. Plots display mean with s.e.; *P < 0.05 by one way ANOVA with Dunnett’s test. g, Schematic of timeline used for over-expression of NRXN1α isoforms. h-j, Quantification of spontaneous spikes after over-expression of individual NRXN1α isoforms in control hiPSC-neurons (1 donor) (h), 5’-NRXN1+/− hiPSC-neurons (1 donor) (i) or 3’-NRXN1+/− hiPSC-neurons (1 donor) (j). k, A model for the contribution of both NRXN1+/− genotype and NRXN1α isoform expression on changes in neuronal activity. g-j, One donor per genotype. Plots display mean with s.e.; *P < 0.05 by one way ANOVA after log-transformation with Dunnett’s test.
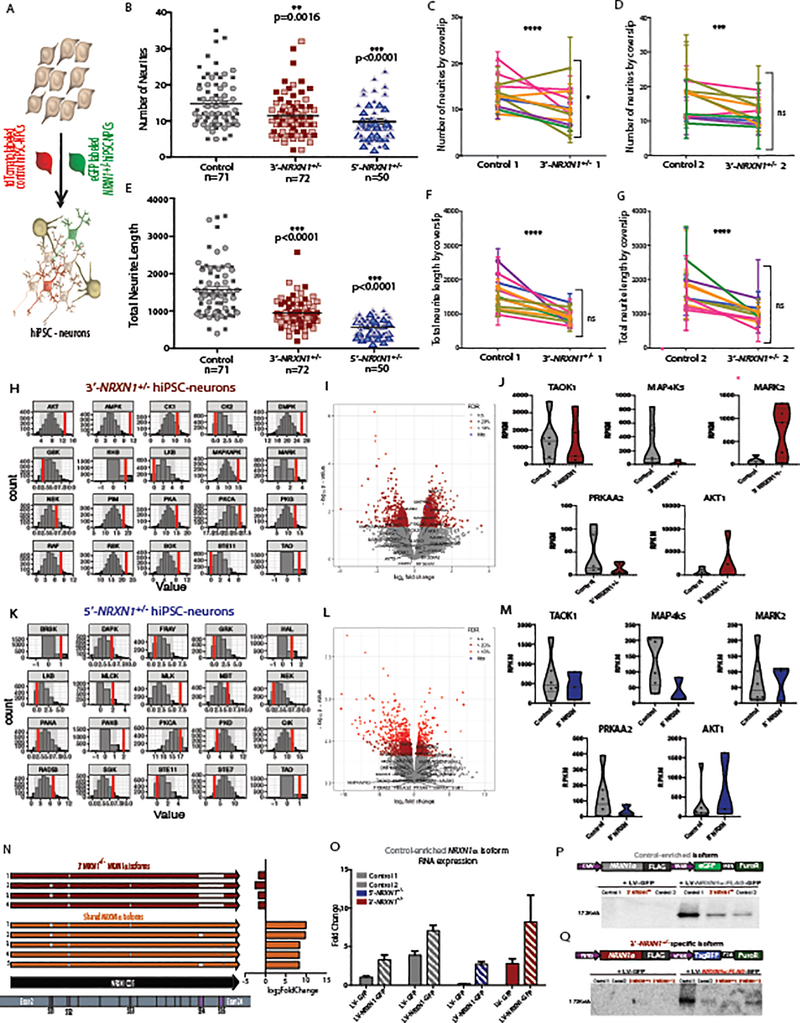
The effect of patient-specific NRXN1+/− deletions on neuronal morphology was examined by comparing reciprocally labeled, low-density plated tdTomato-positive control hiPSC-neurons and eGFP-positive NRXN1+/− hiPSC-neurons, differentiated on a control hiPSC-neuron lawn (Extended Data Fig. 8a–g), allowing us to focus on cell-autonomous NRXN1-related phenotypes, as all synaptic inputs of the traced neurons were expected to originate from control pre-synaptic neurons. Confocal imaging and semi-automated neuronal tracing after 6 weeks of differentiation revealed decreased neurite number (Extended Data Fig. 8b, 5’-NRXN1+/− P < 0.001; 3’-NRXN1+/− P = 0.002 by one-way ANOVA with Dunnett’s test) and total length (Extended Data Fig. 8e, 5’-NRXN1+/− P < 0.001; 3’-NRXN1+/− P < 0.001 by one-way ANOVA with Dunnett’s test) in NRXN1+/− hiPSC-neurons compared to two controls.
The impact of NRXN1+/− deletions on cellular signaling was assessed through interrogation of perturbed Ser/Thr kinase activity in hiPSC-neurons (Extended Data Fig. 8h–m). The kinase activity of 5’- and 3’-NRXN1+/− hiPSC-neurons was compared to controls individually. While there were unique kinases across the comparisons (3’- NRXN1+/− Extended Data Fig 8h; 5’-NRXN1+/− Extended Data Fig. 8k and Supplementary Table 20), many of the kinases that showed differential kinase activity and differential expression by whole transcriptome RNA-seq were shared across 5’- and 3’-NRXN1+/− hiPSC-neurons, including TAOK1 and AKT1 (3’- NRXN1+/− Extended Data Fig. 8i,j; 5’-NRXN1+/− Extended Data Fig. 8l,m).
Expression of specific NRXN1α isoforms may impact neuronal activity in a genotype-dependent manner
We tested the extent to which decreased neuronal activity in NRXN1+/− hiPSC-neurons reflected a decrease in wild-type NRXN1α isoforms and/or potential dominant-negative activity of mutant patient-specific NRXN1α isoforms. Individual NRXN1α isoforms were selected for overexpression studies: four wild-type isoforms shared between all hiPSC-neurons but significantly decreased in 3’-NRXN1+/− hiPSC-neurons (Extended Data Fig. 8n), and four mutant isoforms unique to 3’-NRXN1+/− hiPSC-neurons and not detected in controls (Extended Data Fig. 8n). Lentiviral expression of the wild-type isoform resulted in a 2- to 7-fold increase of NRXN1 expression after 48 hours (Extended Data Fig. 8o).
Expression of all four wild-type NRXN1α isoforms tested significantly increased population-wide neuronal activity after 2 weeks of expression in 5’-NRXN1+/− deletion hiPSC-neurons (Fig. 6i; P < 0.05 by one-way ANOVA with Dunnett’s test to GFP-alone). Reciprocally, expression of two of the four mutant NRXN1α isoforms evaluated significantly decreased neuronal activity after two weeks of expression in control hiPSC-neurons (Fig. 6h; P < 0.05 by one-way ANOVA with Dunnett’s test). Surprisingly, neither the wild-type nor mutant isoforms tested impacted 3’-NRXN1+/− hiPSC-neuron activity (Fig. 6j by one-way ANOVA with Dunnett’s test).
Overall, our data support a model whereby functional deficits in 5’-NRXN1+/− neurons arise from NRXN1 haploinsufficiency and can therefore be rescued by overexpression of wild-type NRXN1α isoforms, but unexpectedly, haploinsufficiency in 3’-NRXN1+/− neurons is exacerbated by novel dominant-negative activity of mutant splice isoforms, and so cannot be rescued by simply increasing wild-type NRXN1α levels (Fig. 6k). Non-recurrent heterozygous deletions in NRXN1+/− seem to impact neuronal function through different mechanisms, dependent on the precise patient-specific mutations involved.
DISCUSSION
Our report links patient-specific, heterozygous intragenic deletions in NRXN1 to isoform dysregulation and impaired neuronal maturation and activity in a human and disease-relevant context. NRXN1α alternative splicing is disrupted in NRXN1+/− hiPSC-neurons; patient-specific perturbations include decreased expression of wild-type NRXN1α isoforms, and, in a subset of cases, the production of mutant NRXN1α isoforms. Mutant NRXN1α isoforms may be particularly biologically relevant as our experimental data demonstrated that overexpression of even a single mutant isoform was sufficient to perturb neuronal activity in control neurons and that overexpression of control isoforms could only ameliorate activity deficits in patient hiPSC-neurons in the absence of mutant isoform expression. Overall, our data, when combined with the published literature (reviewed in ref. 21), suggest that NRXN1α haploinsufficiency impairs neuronal maturation in addition to synaptic activity.
The consensus roles for neurexins are as organizers of neurotransmitter release by coupling calcium channels to the presynaptic machinery8 and trans-synaptic organizers of post-synaptic proteins resulting in stabilization of AMPARs39,40. Although neurexins and their ligands have also been linked to synapse formation41–45, deletion of all three α-Nrxns8 or all three β-Nrxns46 impaired neurotransmitter release without altering glutamatergic synapse density in mice, and pan-Nrxn disruption of all α- and β-Nrxns dramatically reduced synapse stabilization and functional maturation47. Our scRNA-seq, morphological, and population-wide neuronal activity analyses fit a model whereby NRXN1+/− hiPSC-neurons do not mature along the same trajectory as control hiPSC-neurons. Moreover, the lack of observed deficits in SYN1-puncta number and synaptic marker gene expression in NRXN1+/− hiPSC-neurons suggests that synapses form but remain immature, consistent with the expression of synaptic-associated proteins in the immature neuronal clusters by scRNA-seq. While these data provides insights into the neuronal impact of patient-specific NRXN1+/− deletions, the causal mechanisms remain unclear: does altered neuronal maturation lead to impaired synaptic function, or does aberrant synaptic activity limit neuronal maturation through an activity-dependent mechanism? Future experiments are needed to disentangle the extent to which perturbations in NRXN1 splicing independently perturb neuronal maturation, synaptic initiation, stability and activity across neurodevelopment and in a cell-type-specific manner. It is critical to disentangle the potentially additive effects of loss of wild-type NRXN1 isoforms and aberrant generation of mutant NRXN1 isoforms, particularly whether mutant isoforms are localized to the synapse, and the extent to which mutant isoforms impair the function of wild-type isoforms (perhaps similar to protocadherins48) or directly interfere with neuronal function.
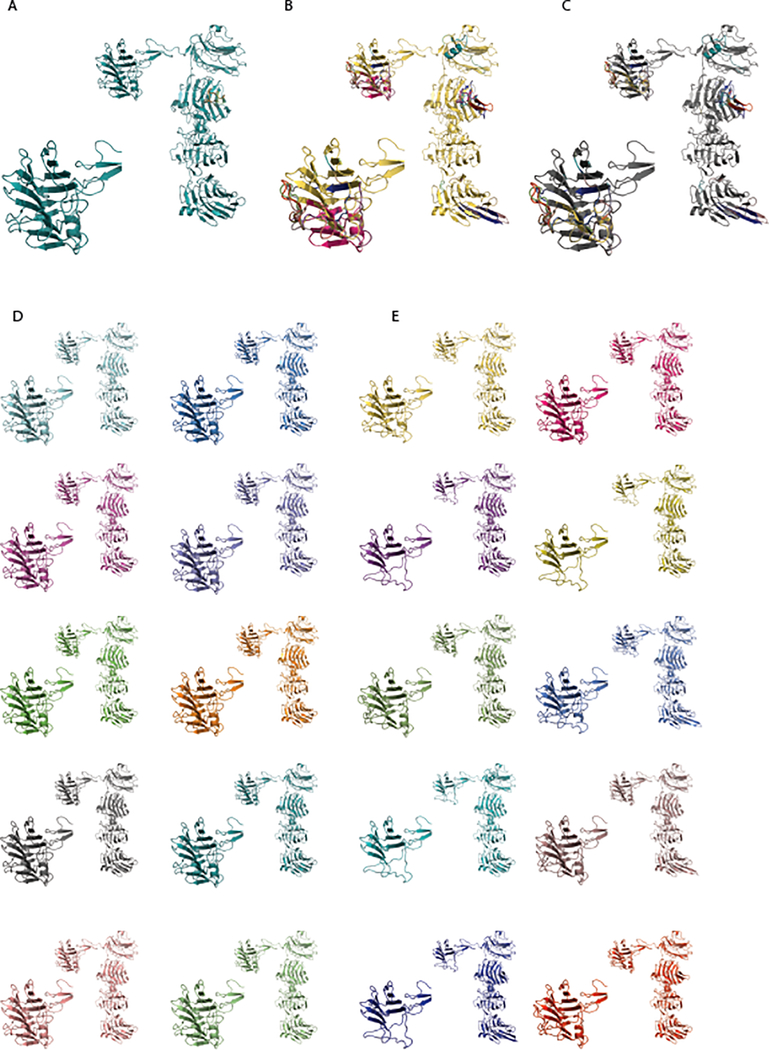
We demonstrated that hiPSC-neurons to a large extent recapitulate the in vivo splice repertoire. We observed significantly reduced expression of 49 (50%) wild-type NRXN1α isoforms in two 3’-NRXN1+/− cases and identified 31 mutant isoforms not detected in controls. Increasing even a single differentially expressed wild-type NRXN1α isoform ameliorated neuronal activity in NRXN1+/− hiPSC-neurons that did not express mutant isoforms, whereas mutant isoforms decreased neuronal activity levels in control hiPSC-neurons. Protein models partially predicated protein structure of the top ten most abundant wild-type and mutant isoforms, suggesting that, whereas wild-type isoforms are largely conserved (Extended Data Fig. 9a,d), 3’-NRXN1+/− mutant isoform models may be more variable (Extended Data Fig. 9b–c,e), particularly near the C-terminus where the 3’-NRXN1+/− deletion is located (Extended Data Fig. 9 insets). Dominant-negative activity by patient-specific mutant NRXN1α may be a widespread phenomenon: up to 8/35 (23%) of identified NRXN1+/− exonic deletions in the PGC dataset may be capable of producing novel translated (mutant) isoforms. Moving forward, it will be important to empirically evaluate the extent to which these putative mutant isoforms can exacerbate NRXN1 related phenotypes.
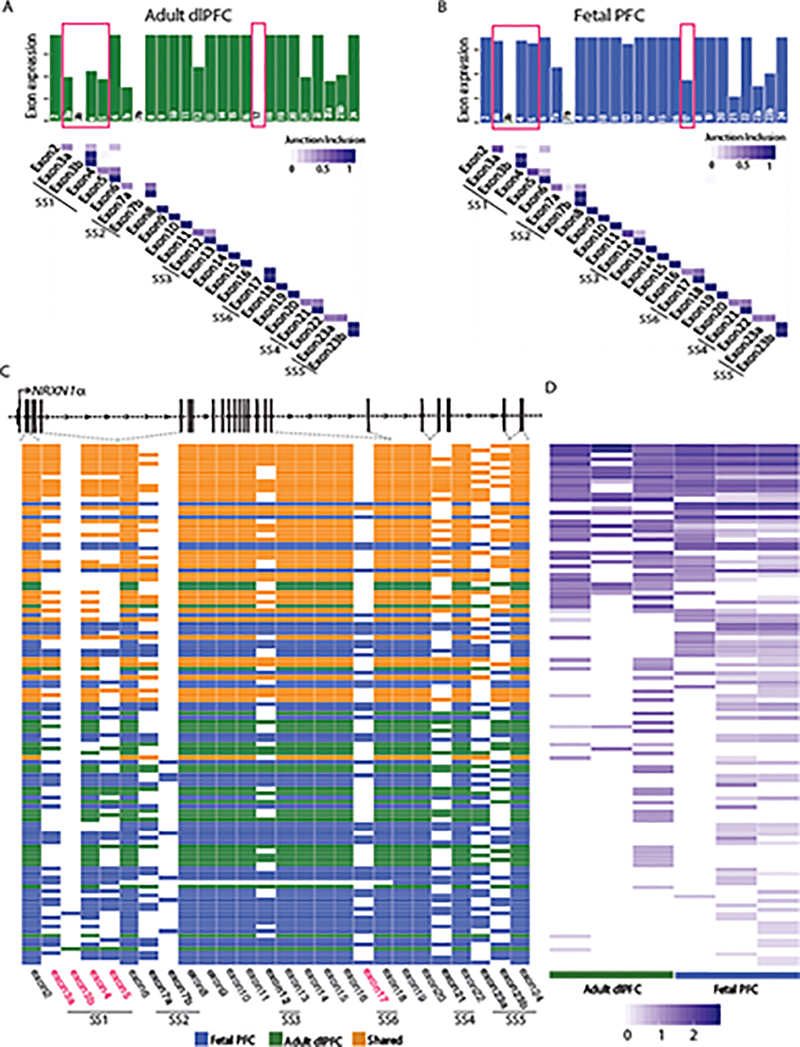
The complexity of the NRXN1α transcriptional landscape varies by neuronal cell-type15, is impacted by neuronal activity49–51, is epigenetically regulated49, and directly impacts synaptic plasticity39. We identified 54 NRXN1α isoforms shared across isogenic NGN2-glutamatergic and ASCL1/DLX2-GABAergic hiPSC-neurons and 25 subtype-specific isoforms. Comparison of NRXN1α isoforms across fetal and adult PFC samples revealed 55% of fetal isoforms to not be found in adult dlPFC samples, suggesting that developmental regulation occurs (Extended Data Fig. 10), particularly decreased inclusion of exons 3a, 4, 5 (SS1) and exon 17 (SS6) in adult dlPFC (Extended Data Fig. 10a,b). We similarly observed a developmental splicing switch in vitro, identifying a 3-fold increase in the exclusion of SS4 (SS4-) with neuronal differentiation from hiPSCs (Extended Data Fig. 6g–i). Because the 3’-NRXN1+/− encompassed SS4, which undergoes activity-regulated exclusion49,51, we examined the impact of patient-specific mutations on the inclusion/exclusion of NRXN1α canonical splice sites following neuronal depolarization by KCl (4 h 50 μM KCl treatment, relative to a PBS vehicle). In control hiPSC-neurons, SS4 exclusion (SS4-) showed the greatest activity-dependent change (1.5-fold, P = 0.039 Wilcoxon test) (Extended Data Fig. 6d–f), whereas 3’-NRXN1+/− hiPSC-neurons did not (Extended Data Fig. 6d–f). Given that SS4 regulates NRXN1 binding affinity to multiple post-synaptic partners (reviewed in ref. 21), including NLGN1β52,53, LRRTMs54–56, and the CBLNs42, these initial findings warrant further investigation into how patient-specific NRXN1+/− deletions impact the NRXN1α repertoire throughout neurodevelopment, across more neuronal subtypes, and in response to neuronal activity, in order to better understand how patient-specific isoform combinations impact protein-protein interactions and synaptic function.
Psychosis risk reflects a complex interaction of rare57 and common variants35. While idiopathic postmortem and hiPSC-based studies remain under-powered24,33, the effect sizes of NRXN1 deletions are dramatically larger2–5. Because patient-recruitment is limiting for this rare mutation (0.21% of a clinical population5) and the size of the deletions with no flanking segmental duplications make isogenic strategies unavailable, we generated multiple independent hiPSC clones per donor. We note the extent that analyses were repeated between donors, hiPSC clones and independent differentiations, while carefully controlling for spurious RNA-seq effects that can arise when using multiple independent samples per donor24,58. Although our cohort size would be unsuitable as an idiopathic study, it is comparable to recent hiPSC-based psychiatric studies of rare variant effects59–65. Multi-electrode arrays do not provide synaptic-level resolution, and the differences we observed in population-wide neuronal activity in NRXN1+/− hiPSC-neurons likely reflect the delayed maturation of NRXN1+/− hiPSC-neurons we identified through scRNA-seq, but may also be impacted by changes in synaptic activity. We unexpectedly also observed decreased neurite branching in NRXN1+/− hiPSC-neurons, a phenotype similar to observations in Xenopus models66 and a mouse model of double α-Nrxn deletions67. Overall, larger NRXN1+/− cohorts are necessary to better discriminate molecular, structural and synaptic effects of distinct patient-specific mutations.
Our NRXN1-specific findings may yield broader insights into schizophrenia. Identifying the repertoire and abundance of NRXN1α transcriptional variants is important for understanding protein diversity at human synapses, which will ultimately help to reveal how patient-specific deletions in NRXN1 contribute to a number of psychiatric and neurodevelopmental disorders. Evaluating how loss and/or gain of specific NRXN1 isoforms impact neuronal fate, maturation and function in a cell type-specific and activity-dependent manner represents a critical first step towards a more genetics-based form of precision medicine. Understanding how NRXN1+/− deletions perturb the splice repertoire and alter neuronal function could ultimately improve genetic diagnosis, prognosis and/or lead to new therapeutic targets.
ONLINE METHODS
Cohort
From a cohort of cases recruited to study childhood-onset schizophrenia (COS), four individuals with NRXN1 deletions were identified by IlluminaOmni 2.5 bead chip genotyping. The first two were a mother/son pair carrying 5’-deletions (~115 kb) in NRXN1; the son was diagnosed with childhood-onset bipolar disorder with psychosis and the mother with adult-onset bipolar disorder with psychosis. The others were two monozygotic twins carrying 3’-deletions (~136 kb) in NRXN1, one diagnosed with childhood-onset schizophrenia, the other with adult-onset schizoaffective disorder (Table 1). All human sample collection was done de-identified in accordance with the policies of Icahn School of Medicine at Mount Sinai and in regulation with its institutional review board.
Reprogramming and differentiation
Skin biopsies were obtained from four cases, four unrelated controls and one non-carrier relative. Fibroblasts were re-genotyped using PsychChip and exome sequencing19,20. hiPSCs were reprogrammed via sendai viral reprogramming (Life Technologies) and validated by karyotyping, gene expression and protein immunocytochemistry as described previously24,70. Human fibroblasts (HFs) were grown in HF media on 0.1% gelatin (in milli-Q water) plates. Replicating but nearly confluent HFs were transfected with Cytotune Sendai virus (ThermoFisher Scientific), then allowed to recover for at least 3 days before dissociation with TrypleE (ThermoFisher Scientific) and replatting onto a 10-cm dish containing 1 million mouse embryonic fibroblasts (MEFs). Cells were switched to HUES media (DMEM/F12 (Invitrogen), 20% KO-Serum Replacement (Invitrogen), 1x Glutamax (Invitrogen), 1x NEAA (Invitrogen), 1× 2‐mercaptoethanol (Sigma) and 20 ng/ml FGF2 (R&D Systems)) and fed every 2–3 days. hiPSC colonies were manually picked and clonally plated onto 24-well mEF plates in HUES media. At early passages, hiPSCs were split through manual passaging, but at higher passages, hiPSC could be enzymatically passaged with Collagenase (1 mg/ml in DMEM) (Sigma). Karyotyping analysis was performed by Wicell Cytogenetics.
For NPC derivation, hiPSCs were incubated with Collagenase (1 mg/ml in DMEM) at 37 °C for 1–2 hours which lifted colonies, which were then transferred to a nonadherent plate (Corning). Embryoid bodies (EBs) were grown in suspension with dualSMAD inhibition (0.1 μM LDN193189 (Stemgent) and 10 μM SB431542 (Tocris)) N2/B27 media (DMEM/F12-Glutamax (Invitrogen), 1x N2 (Invitrogen), 1x B27 (Invitrogen)). 7-day-old EBs were plated in N2/B27 media with 1 μg/ml Laminin (Invitrogen) onto poly-ornithine/laminin-coated plates. Neural rosettes were harvested from 14-day-old EBs using STEMdiffTM Neural Rosette Selection Reagent (Stem Cell Technologies) for 60 minutes at 37 °C before being plated in NPC media (DMEM/F12, 1x N2, 1x B27- RA (Invitrogen), 1 μg/ml laminin and 20 ng/ml FGF2 on poly-ornithine/laminin-coated plates22–24.
hiPSC-NPCs were grown on Matrigel (BD Biosciences) coated plates in NPC media (Dulbecco’s Modified Eagle Medium/ Ham’s F12 Nutrient Mixture + Glutamax (ThermoFisher Scientific), 1x N2, 1x B27-RA (ThermoFisher Scientific) and 20 ng/ml FGF2 and maintained at high density by splitting 1:3 every week with Accutase (Millipore). hiPSC-neurons were generated through two independent approaches. For forebrain neuronal differentiation, hiPSC-NPCs were seeded at low density and cultured in neural differentiation medium (DMEM/F12 + Glutamax, 1x N2, 1x B27-RA, 20 ng/ml BDNF (Peprotech), 20 ng/ml GDNF (Peprotech), 1 mM dibutyryl-cyclic AMP (Sigma), 200 nM ascorbic acid (Sigma) and 1 μg/ml laminin (ThermoFisher Scientific) 1–2 days after plating. NPC-derived hiPSC-(forebrain)-neurons were differentiated for 6 weeks. Alternatively, induction strategies were used to obtain almost pure populations of hiPSC-neuronal subtypes. NGN2-glutamatergic neuronal induction was performed as previously described26. Briefly, hiPSC-NPCs were seeded at low density and transduced with a lentivirus expressing TetO-NGN2-GFP-Puro or TetO-NGN2-Puro along with rtTA. Twenty-four hours after transduction, doxycycline was added to initiate NGN2 expression, and then 24 hours later the cells were selected with puromycin. NGN2-glutamatergic hiPSC-neurons were cultured in neuronal differentiation media and assayed after 3 weeks unless otherwise noted. A similar strategy was used to produce ASCL1/DLX2-GABAergic neurons. hiPSC-NPCs were seeded at low density and transduced with lentiviruses expressing TetO-ASCL1-GFP-Puro and TetO-DLX2-Hygro, along with rtTA. Twenty-four hours after transduction, doxycycline was added to initiate ASCL1 and DLX2 expression followed by selection with puromycin and hygromycin after an additional 24 hours. ASCL1/DLX2-GABAergic hiPSC-neurons were cultured in neuronal differentiation media with doxycycline for 2 weeks then neuronal differentiation media alone for an additional 3 weeks unless otherwise noted. ASCL1/DLX2-GABAergic hiPSC-neurons were treated with Ara-C between weeks 1–3.
Immunocytochemistry
hiPSC-NPCs, hiPSC-neurons and NGN2-neurons were fixed in 4% paraformaldehyde in PBS at room temperature for 10 min. hiPSC-NPCs were permeabilized at room temperature for 15 min in 1.0% Trition in PBS. All cells were blocked in 5% donkey serum with 0.1% Triton at room temperature for 30 min. Primary antibodies, including rabbit anti-NESTIN (Millipore), 1:500; goat anti-SOX2 (Santa Cruz), 1:500; chicken anti-MAP2 (Abcam), 1:500–1:5,000; mouse anti-SYN1 (Millipore), 1:500; mouse anti-GFP (ThermoFisher), 1:1,000; rabbit anti-RFP (ThermoFisher), 1:1,000, rabbit anti-GABA (Sigma) 1:500; were incubated overnight at 4 °C. Secondary antibodies including Alexa donkey anti-rabbit 488, 568, 647 (Invitrogen), Alexa donkey anti-mouse 488, 568, 647 (Invitrogen) and Alexa donkey anti-chicken 647 (Invitrogen) were used at 1:500–1:1,000. DAPI (0.5 μg/mL) was used to visualize nuclei. Coverslips were mounted with Vectashield and imaged using the Zeiss upright 780 confocal microscope.
RNA isolation and preparation
hiPSC-NPCs and hiPSC-neurons were lysed in 1 mL Trizol (Thermoscientific) according to the manufacturer’s protocol. RNA was chloroform extracted, pelleted with isopropanol, washed with 70% ethanol, and re-suspended in water. RNA was treated with RNase-free DNaseI (Promega) for 30 min at 37 °C and then the reaction was inactivated by incubation with stop buffer at 65 °C for 10 min. Human post-mortem samples were homogenized and lysed in 1 mL Trizol. RNA was chloroform extracted and purified and DNAse treated using the RNA Clean & Concentrator with DNAseI Kit (Zymo Research).
Western blotting
Cells were isolated, suspended in 1× RIPA lyses buffer (Sigma) supplemented with Complete Protease Inhibitor tablets (1 per 50 ml) (Roche) and PhosSTOP phosphatase inhibitor tablets (1 per 10 ml), sonicated and then centrifuged at 14,000g for 30 min at 4 °C. Total protein was separated on 4–20% SDS-polyacrylamide gel (Bio-Rad) and transferred to a nitrocellulose membrane (Bio-Rad). The membrane was blocked with 4% bovine serum albumin (Sigma) in 1.0% Tween (Sigma) in PBS and probed with primary antibodies against FLAG (F7425-.2MG, Sigma) and overnight at 4 °C, then with HRP-conjugated secondary antibodies (Sigma) for 2 h at room temperature. The membrane was visualized using Amersham ECL prime western blotting kit (GE, RPN2232). Imaging was done using a Bio-Rad Gel Doc Imaging System; the membrane was cut during imaging.
Predicted NRXN1 isoform structures
The top 10 most abundant wild type and mutant splice isoform sequences were submitted to ExPasy translate tool (https://web.expasy.org/translate/), for translation into amino acid sequences. The amino acid sequence was submitted to Phyre 2 for predicting protein models71. All models returned with 100% confidence.
Whole transcriptome RNA sequencing parameters
RNA sequencing libraries were prepared using the Kapa Total RNA library prep kit with ribo-depletion and strand-specific cDNA library construction (Kappa Biosystems). Paired-end sequencing (125-bp reads) was performed using the Illumina HiSeq2500 platform (New York Genome Center). RNA-seq reads were aligned to GRCh37 with STAR72. Uniquely mapping reads overlapping genes were counted with featureCounts73 using annotations from ENSEMBL v70 while isoform expression was obtained using Kallisto74.
Whole transcriptome RNA-seq analysis
Samples were analyzed using publically available code from Hoffman et al.5. Briefly, sample identity was check by calling variants from the RNA sequencing BAM files using GATK to produce gVCF files. These gVCF files were merged with variants from whole exome sequencing data from the same donor and variant concordance was examined using bcftools. One sample with variant discordance was excluded from downstream analysis. variancePartition software was used to determine and visualize the contribution of a given variable to the variance in expression of each gene75. Hierarchical clustering was implemented in R using complete linkage clustering. A pairwise distance matrix was computed for all samples, and the median distance between all samples in each category was used to create a summary distance matrix using to perform the final clustering. PCA was performed on each cell type individually as well as the combined hiPSC-NPC + hiPSC-neuron data set. To investigate differences in cell type composition in the gene expression data, the cell type composition score was obtained using Cibersort76. Differential expression analysis was done with limma/voom77 and duplicateCorrelation was applied to account for the analysis of multiple samples per donor. Gene set enrichment was performed using a hypergeometric test with gene sets from MSigDB68, MAGMA78 and additional sets from Fromer et al.33 using genes expressed within the combined dataset as background. We examined enrichment for genes with FDR < 30% in either cell type with EnrichR79 using genes expressed within the combined dataset as background. Correlation of t-statistic was done using publically available datasets including CommonMind33, NIMH HBCC (https://www.nimh.nih.gov/labs-at-nimh/research-areas/research-support-services/hbcc/index.shtml) and UCLA datasets34.
As NRXN1 exon expression is highly correlated with its own gene expression, the correlation between NRXN1 exon expression and other genes could be largely driven and biased by overall NRXN1 gene expression level. Therefore, to screen genes that are associated with NRXN1 splicing but not NRXN1 transcription, we calculated the partial correlation coefficients between all genes and each NRXN1 exon, with the NRXN1 gene transcriptional effect regressed away80,81. The genes that showed significant correlation coefficients (FDR < 0.01), were selected for further gene set enrichment analysis. This analysis was performed for hiPSC-neuron and CommonMind33 dlPFC datasets.
Generation of NRXN1α cDNA for targeted sequencing
For targeted NRXN1α library preparation first strand cDNA synthesis was performed on 500 ng of RNA using 0.5 μM of a primer complementary to the last exon of NRXN1α (CAGAAACCGGGATGAAGGCT). The cDNA was amplified in a 50-μL reaction with 4 μL of cDNA as template, LA Taq, and primers complementary to the first (TGGTGCCCTAAAGAGGCAAG) and last (same as above) coding exons of NRXN1α with 35 cycles (Supplementary Tables 16 and 17).
For targeted Illumina sequencing, the PCR product was then run on a 1% agarose gel and gel extracted using the Genejet gel extraction and DNA cleanup micro kit (ThermoFisher). Gel extracted cDNA was library prepped using the Nextera XT DNA library preparation kit (Genewiz). Libraries from four samples were pooled and then sequenced using Illumina MiSeq or HiSeq (2 × 150-bp reads).
For Pacific Biosciences targeted Iso-seq preparation, the NRXN1α PCR products were purified with Agencourt AMPure XP magnetic beads (Beckman Coulter) at a volume ratio of 0.5:1 (magnetic beads:PCR product). The cDNA was quantified using the Qubit HS dsDNA Kit and quality was assessed using the Agilent 2100 bioanalyzer. SMRT bell sequencing libraries were prepared using Pacific Biosciences DNA Template Prep Kit according to the 5-kb template preparation and sequencing protocol provided by Pacific Biosciences prior to purification and size binning to proper molecular range using Sage BluePippin. SMRT bell templates were bound to polymerases using DNA/Polymerase Binding Kit XL 1.0 (100–150-800) and v2 primers. Sequencing was carried out on the Pacific Biosciences RSII real-time sequencer using P6 sequencing reagents with 10-hour movies. Each sample was sequenced on one SMRT cell, yielding a total of 165,753,313 reads of insert (average across all samples) for NRXN1α.
Analysis of human NRXN1α targeted short read data
The human NRXN1α targeted Illumina cDNA reads were aligned to the human genome (hg19) using the spliced gap aligner STAR72. Only reads mapped to the region between the 5’ and 3’ primers were kept for the following analysis. Read quantitation at the exon level was done using the Subread package featureCounts73 based on the GENCODE genome annotation GTF file. The junction sites were extracted from the bam file according to JI tags. Given an exon with canonical junction sites, say exoni, its exclusion value was calculated from the junction reads as follows:
where exoni−1, exoni, and exoni+1 represent three adjacent exons, and junction(exoni−1 → exoni) represents the number of reads covering the junction between exoni−1 and exoni.
Kallisto was used for isoform-level short read-based quantitation74.
Analysis of human NRXN1α targeted long read data
Subread filtering was performed using Pacific Biosciences SMRT analysis software (v2.3.0). The human NRXN1α PacBio Iso-seq raw reads were constructed into Circular Consensus Sequences (CCS) and non-CCS subreads. Next, CCS was classified as full-length if both the 5’ and 3’ primers were present. To further improve the accuracy, we used ICE (Iterative Clustering for Error Correction) to cluster isoforms into consensus and used Quiver to polish the full-length consensus sequences based on both full-length and non-full-length reads. This method generated full-length isoforms with an expected post-correction accuracy of >99%. The polished high QV (phqv) isoform consensuses were mapped to the human genome (hg19) using STARlong72. The junction sites were extracted from the bam file based on the JI tags, and further corrected by junction sites from both the targeted Illumina short reads and the genome annotation GTF file. Based on the corrected junction sites, the phqv consensuses were clustered. The number of full-length reads corresponding to an isoform consensus was used as its expression and thresholded for ≥7 full length reads as described above. DEGseq82 was used to call differential gene expression.
Analysis of mouse Nrxn1α targeted long and short read data
We generated the mouse Nrxn1α targeted Illumina cDNA reads, and aligned the reads to the mouse genome (mm10) with STAR. The reads mapped between 5’ and 3’ primers were kept for the following analysis. The mouse Nrxn1α Isoseq CCS reads (≥2 passes) were downloaded from SRA (SRR1184043), and mapped to the mouse genome (mm10) with STARlong. The full-length reads covering both 5’ and 3’ primers were kept for the following analysis. The junction sites from the Iso-seq long reads were further corrected based on targeted Illumina short reads and the genome annotation GTF file. The number of full-length reads corresponding to an isoform consensus was used as its expression. Based on the correspondence between mouse and human Nrxn1α exon annotations, the overlap of Nrxn1α isoforms were compared between human and mouse.
Axion multi-electrode array
hiPSC-NPCs from two controls, one 5’- and two 3’-NRXN1+/− cases were plated onto a 48-well multi-electrode array (MEA) plate and differentiated as hiPSC-neurons or induced NGN2-neurons over seven weeks. Each 48-well MEA plate from Axion Biosystems was coated with 2 μg/mL Matrigel 24 hours prior to seeding. hiPSC-NPCs were spotted at a density of 8,000 cells per well onto 6–12 wells per line. Half media change was performed every other day using neuron differentiation media. For over-expression experiments, lentiviruses expressing specific NRXN1α isoforms synthesized by Genecopoeia were added to directly onto the MEA plate of 4-week hiPSC-neurons and left overnight. After 24 hours, a full media was performed and the lentiviruses were allowed to express for 2 weeks before recording hiPSC-neurons at 6-week time point. Extracellular 15-minute recordings of spontaneous action potentials were performed at 37 °C using a Maestro MEA system and AXIS software (Axion Biosystems). Data were sampled at rate of 12.5 kHz with a 200–2500 Hz single-order Butterworth band-pass filer and a threshold for spike detection at 5.5 times the rolling standard deviation of the filtered field potential on each electrode. Spike time stamps were exported to Neuroexplorer (Axion Biosystems) for creation of raster plots, and all other data was exported as csv file for further analysis. If data stratified normality assumptions, one-way ANOVA with Dunnett’s test for multiple comparisons was performed on the spike counts. However, isoform overexpression data violated this assumption of normality and therefore spike counts were log-transformed performing the one-way ANOVA to satisfy this assumption.
Neuronal tracing
Unlabeled control hiPSC-NPCs were plated onto 24-well matrigel coated plates with coverslips. Control hiPSC-NPCs were transduced with a scramble_gRNA-eGFP-puro expressing lentivirus while NRXN1+/− hiPSC-NPCs were transduced with scramble_gRNA-tdTomato-puro expressing lentivirus. A small number of control tdTomato labeled and NRXN1+/− eGFP-labeled hiPSC-NPCs were spiked into the unlabeled background of hiPSC-NPCs upon plating. hiPSC-NPCs were then differentiated for 6 weeks into hiPSC-neurons and immunostained using mouse anti-GFP (ThermoFisher), 1:1,000; rabbit anti-RFP (ThermoFisher) 1:1,000; with Alexa donkey anti-mouse-488 and Alexa donkey anti-rabbit-568 secondary antibodies as described above. Individual neurons were imaged at 20x on the Zeiss 780 upright confocal microscope, followed by tracing and analysis using ImageJ Simple Neurite Tracer Plugin. One-way ANOVA with Dunnett’s test was used to test the impact of genotype on neuronal morphology. As only the eGFP 3’-NRXN1+/− were imaged on the same coverslip as tdTomato labeled controls, we assess the impact of coverslip to coverslip variation between these lines using a two-way ANOVA.
qPCR validation
Total RNA was extracted using Trizol following the manufacturer’s instructions and qPCR reactions were done on a QuantStudio™ 7 Flex Real-Time PCR System using the Power SYBR green RNA-to-Ct RT-qPCR kit and gene specific primers (ThermoFisher). 50 ng of RNA template was added to the PCR mix. (ThermoFisher). Reaction conditions were 48 °C for 30 min, 95 °C for 10 min followed by 40 cycles (95 °C for 15 s, 60 °C for 60 s). Primers used are listed in Supplementary Table 18.
Molecular cloning procedures
NRXN1α cDNA was generated as previously described for targeted short-read sequencing. Gel extracted NRXN1α cDNA was ligated into the pCR4-TOPO backbone (ThermoFisher) following the manufacturers guidelines. Individual colonies were picked and screened for full length NRXN1α isoforms by Sanger sequencing (Genewiz). Two specific NRXN1α isoforms in the pCR4-TOPO backbone were chosen for further cloning into a lentiviral expression vector. A 4.5-kb fragment containing most of coding sequence of NRXN1α was amplified from the pCR4-TOPO backbone. An upstream region of the first coding exon and a downstream region of the last coding exon fused to a 3xFLAG tag were amplified from two synthetic plasmids containing these sequences (Thermofisher). Fragment amplification was performed using Q5 polymerase following manufactures protocol using appropriate primers (Supplementary Table 19). Fragments were assembled using the NEBuilder HiFi DNA Assembly Master Mix following the manufacturers protocol and the completed assembly was transformed into Stbl3 Chemically Competent E. coli (ThermoFisher), and positive clones were confirmed by restriction digest and Sanger sequencing (Genewiz). Lentiviruses were produced from these vectors as previously desceribed22. Physical titration of lentivirus was performed by using a qPCR Lentivirus Titration Kit (ABM).
Single cell sequencing
Six hiPSC-neuron (two control, two 3’-NRXN1+/−, and two 5’-NRXN1+/−) samples were differentiated into hiPSC-neurons for six weeks as previously described. To harvest, Accutase was added to the hiPSC-neurons and incubated at 37 °C for 10–15 minutes. The hiPSC-neurons were then gently pipetted 2–3 times, transferred into DMEM for wash and spun at 600g for 4 minutes. The hiPSC-neurons were gently re-suspended in 500 μL of PBS +0.04% BSA and passed through a 0.5-μM filter. The hiPSC-neurons were then counted and re-suspended to a concentration of 1,000 cells/μL in 25 μL. Single-cell RNA-seq (sc-RNA-seq) was performed on these samples using the Chromium platform (10x Genomics) with the 3’ gene expression (3’ GEX) V2 kit, using an input of ~10,000 cells. Libraries were prepared as directed by the manufacturer and sequenced on a HiSeq2500 (Illumina) targeting a minimum depth of 50,000 reads per cell. Sequencing reads were then aligned to hg38 using the CellRanger pipeline from 10x Genomics. One of the 3’-NRXN1+/− had a much lower mean reads per cell than the other samples and therefore was not considered in the final analysis. All downstream sc-RNA-seq analysis was done using the Seurat package in R. Reads were filtered for mitochondria, ribosome and HLA related genes, and for cells expressing a minimum of 200 genes. Each sample was then normalized, scaled and variable genes were identified individually. The variable genes across samples were then used in the RunMultiCCA function considering 20 CCS. Clusters were identified on the integrated dataset using the FindClusters function and considering 12 dimensions and a resolution of 0.8. tSNE plots were generated using the same 12 dimensions. Marker genes as well as differential expression analysis using a non-parametric Wilcoxon rank sum test within each cluster was performed.
Kinase assay
Cell pellets generated from cultures of hiPSC-neurons from two controls, the male 5’-NRXN1+/− and both 3’-NRXN1+/− were lysed on ice for 30 min using M-PER lysis buffer (ThermoFisher) containing 1:100 Halt Protease and Phosphatase Inhibitor Cocktail (ThermoFisher). Samples were centrifuged (14000 rpm, 10 min, 4 °C), and the supernatants collected and assayed for total protein concentration (Pierce BCA Protein Assay Kit, ThermoFisher). Samples were run in triplicate on the kinome array, using one chip for control vs. 3’-NRXN1+/− hiPSC-neurons and a second chip for control vs. 5’-NRXN1+/− hiPSC-neurons. Identical protein amounts were loaded for each condition.
Profiling of serine-threonine kinase activity was performed using the PamStation12 microarray (PamGene International) and STK (4-well) PamChips containing 144 consensus phosphopeptide sequences (3 of which are internal controls) per well, immobilized on porous ceramic membranes. Each PamChip well was blocked with 2% bovine serum albumin (BSA) before 2 μg of protein in the manufacturer’s kinase buffer (PamGene), 157 μM adenosine triphosphate (ATP), and FITC-labeled anti-phospho serine-threonine antibodies (PamGene) were added in each well. The homogenized samples containing the active kinases and assay mix were pumped through the wells to facilitate interaction between kinases in the sample and specific peptide substrates immobilized on the chip. The degree of phosphorylation per well was measured in real time using Evolve (PamGene) kinetic image capture software. The software captures FITC-labeled anti-phospho antibodies binding to each phosphorylated peptide substrate every 6 sec for 60 min. Peptide spot intensity was captured across multiple exposure times (10, 20, 50, 100, 200 ms) during post-wash, and the linear regression slope was calculated and used as the signal (i.e. peptide phosphorylation intensity) in comparative analyses.
The signal ratio between pairs of samples (control vs. NRXN1+/−) was used to calculate fold change (FC) for each peptide. Peptides with a FC of at least 15% (i.e. FC > 1.15 or FC < 0.85) were considered changed in degree of phosphorylation. This threshold value was guided by previous reports suggesting that changes in kinase activity with similar (or smaller) orders of magnitude are sufficient to trigger biologically relevant changes83–85. Peptides that were undetectable or non-linear in the post-wash phase (i.e. the coefficient of determination R2 of the corresponding linear regression less than 0.90) were excluded from subsequent analyses. Genes related to hits in the kinome array for either control vs. 3’-NRXN1+/− or control vs. 5’-NRXN1+/− were then intersected with whole-transcriptome RNA-seq results which compared the differential expression of the same hiPSC donors.
Statistical analysis
Data from all phenotypic described above were first organized in a Microsoft Excel spreadsheet and analyzed using GraphPad PRISM 8 software or Rstudio. For MEA, qPCR data analysis and imaging analysis, values are expressed as mean ± s.e.m. All boxplots and violin plots represent the median and quartiles of the data. Statistical significance was tested using either two-sided Student’s t test, one-way ANOVA with Dunnett’s post-hoc test or two-way ANOVA with Holm-Sidak’s test as noted in the figure legends. Whole transcriptome RNA-seq analysis was performed in R using DeSeq2 and single-cell sequencing analysis was performed in R using Seurat. More information can be found in the Life Sciences Reporting Summary.
Extended Data
Extended Data Fig. 1. Validation of deletions in hiPSC cohort and whole transcriptome RNA-seq analysis.
a, Schematic showing the structure of the NRXN1 gene and location of 5’-((blue) and 3’-deletions (red). b,c, Mean and s.e. of Taqman CNV assay confirming 3’-CNV in fibroblasts from one 3’-NRXN1+/− case (b) and 5’-CNV in fibroblasts from both 5’-NRXN1+/− cases (c); two replicates per sample per probe. d, PCR of cDNA across exons encompassed by the 3’-deletion in controls and 3’-NRXN1+/− hiPSC-NPCs, two independent validations. e, Mean and s.e. of the log2FoldChange by qPCR across the novel junction (exon 20–24) created by 3’-deletion across 2 controls and 2 3’-NRXN1+/− hiPSC-NPCs compared using a two-sided t-test. f, Sanger sequencing result from a TOPO cloned NRXN1α isoform from 3’-NRXN1+/− hiPSC-neurons (n = 1) confirming presence of novel exon junction (exon 20–24). g, Confirmation of the sex of each sample. h, PCA plot of combined hiPSC-NPC (19 samples, 8 donors) and hiPSC-neuron (18 samples, 8 donors) RNA-seq dataset showing separation by cell type on PC1. i,j, Volcano plot showing differentially expressed genes within hiPSC-NPCs (i) and hiPSC-neurons (j) individually. k, FPKM of NRXN1 expression across fetal PFC (1), adult dlPFC (3) and control hiPSC-neurons (3). l, Circle plot showing hierarchical clustering of samples by cell type and by donor. m,n Pearson correlation of gene expression within and between donors in hiPSC-NPCs (19 samples, 8 donors) (m) and hiPSC-neurons (18 samples, 8 donors) (n) by one-sided Wilcoxon test. o, Gene set enrichments for genes correlated with NRXN1 spicing in the Common Mind Consortium dlPFC dataset.
Extended Data Fig. 2. Cell type composition.
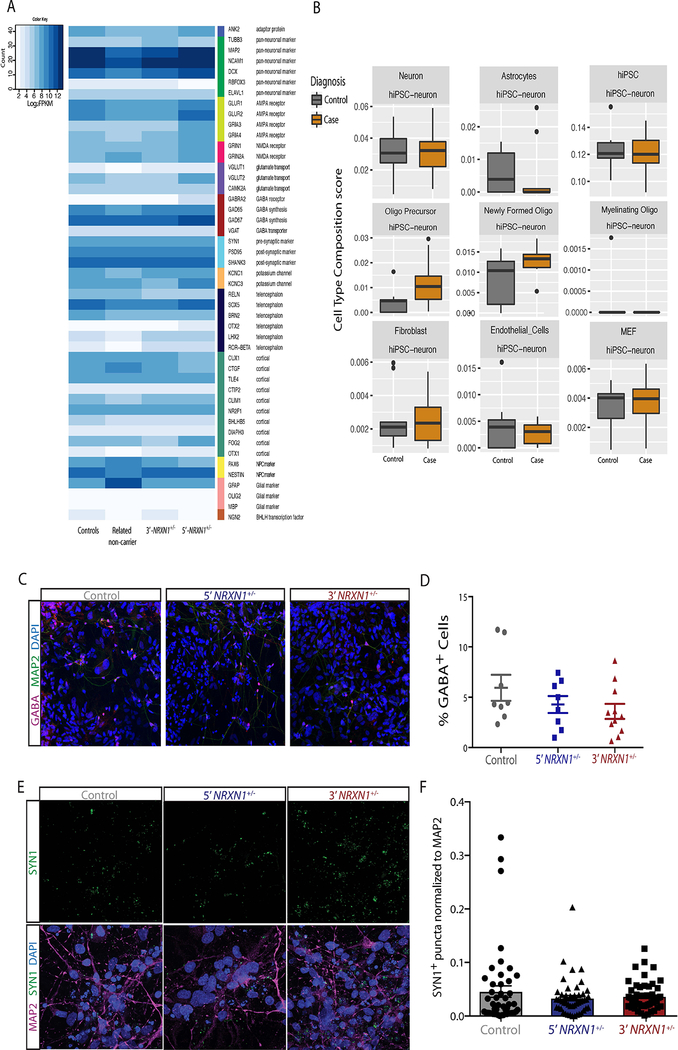
a, Heatmap showing log2FPKM values of sub-type marker genes in hiPSC-neurons across genotypes. b, Cell type composition scores obtained using Cibersort4 in hiPSC-neurons (9 controls, 4 donors; 9 cases, 4 donors), by diagnosis. c, Images of GABA immunostaining overlaid with MAP2. d, Mean percent of GABA+ cells from control (8 images, 2 coverslips), 5’-NRXN1+/− (8 images, 2 coverslips) and 3’-NRXN1+/− (11 images, 3 coverslips). Error bars are s.e. e, Representative images of SYN1 immunostaining alone and overlaid with MAP2 immunostaining and DAPI. f, Mean intensity of SYN1+ puncta normalized to MAP2 intensity (3 images per coverslip, 8 coverslips per donor, 2 donors per genotype). Error bars are s.e.
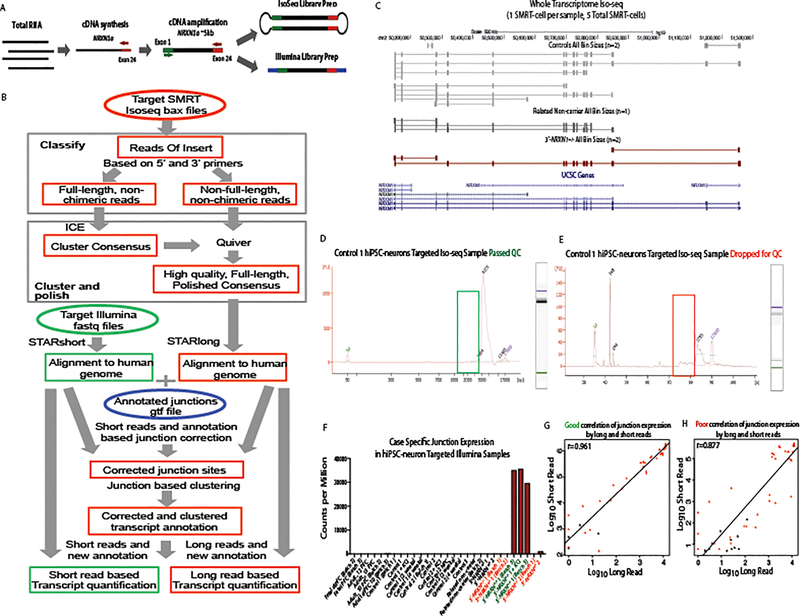
Extended Data Fig. 3. Pipeline Schematic and quality control of Iso-seq data.
a, Schematic of the sample preparation for the hybrid sequencing approach. b, Schematic of the computational pipeline developed for the hybrid sequencing approach. c, UCSC genome browser view of whole transcriptome Iso-seq data across the NRXN1 locus from five hiPSC-neuron samples. d,e, Representative bioanalyzer traces from Iso-seq library prep passing QC (d) compared to library prep failed QC (e). f, Targeted short-read sequencing counts per million for 3’-NRXN1+/− specific junction site showing 3’-NRXN1+/− hiPSC-neurons passing QC in green and failing QC in red. g,h, Pearson’s correlation of junction site expression from targeted long read vs. targeted short read data showing one of the samples passing QC (g) and one sample failing QC (h).
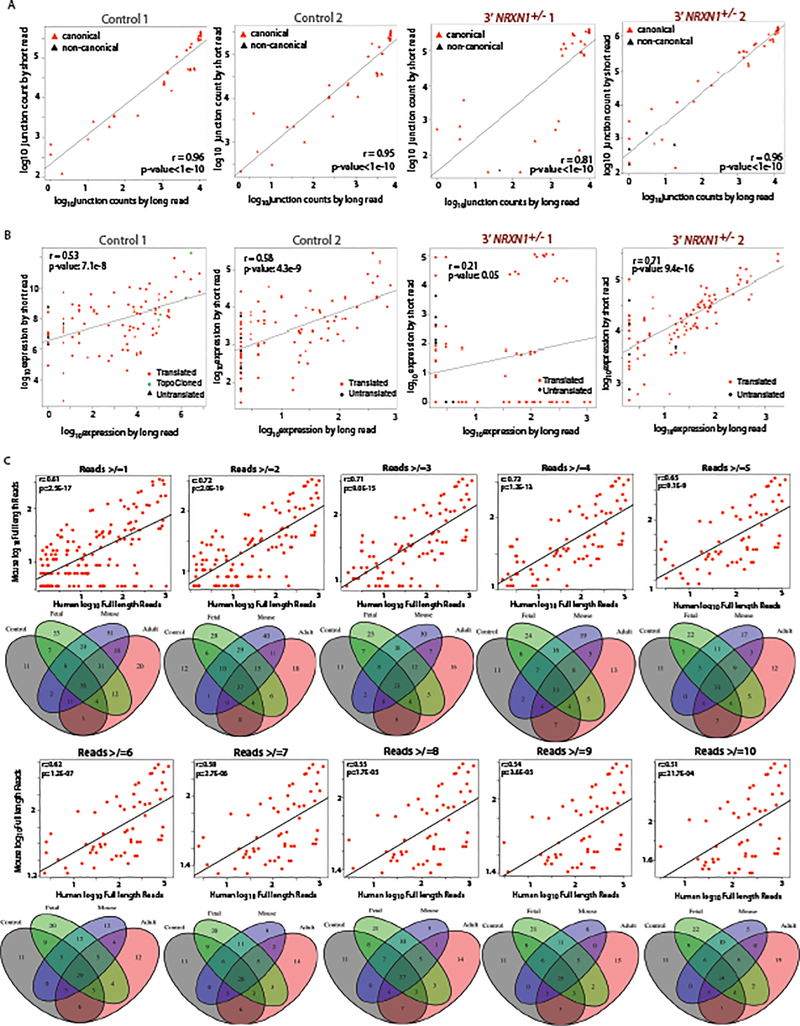
Extended Data Fig. 4. Comparison of long and short read data for quantification and threshold testing.
a, Correlation of NRXN1α junction expression from long read and short read sequencing across control (control 1 n = 39, control 2 n = 37) and 3’-NRXN1+/− (3’-NRXN1+/− 1 n = 36, 3’-NRXN1+/− 2 n = 45) hiPSC-neuron samples. Red triangles represent canonical junctions while black represent non-canonical. b, Correlation of NRXN1α isoform expression from long read quantification and short read quantification across control (Control 1 n = 90, Control 2 n = 88) and 3’-NRXN1+/− (3’-NRXN1+/− 1 n = 89, 3’-NRXN1+/− 2 n = 96) hiPSC-neuron samples. Colored triangles represent in-frame isoforms, predicted to be translated (red), untranslated (black) and TOPO cloned (green). c, Correlation of mouse and human NRXN1α isoform expression and corresponding Venn diagrams for the number of isoforms across expression thresholds (≥2 n = 112, ≥3 n = 88, ≥4 n = 75, ≥5 n = 63, ≥6 n = 60, ≥7 n = 57, ≥8 n = 54, ≥9 n = 52, ≥10 n = 50).
Extended Data Fig. 5. Cell type specific NRXN1 expression.
a,b, PCA of isogenic samples differentiated into three hiPSC-neuronal cell types colored by cell type (ASCL1/DLX2 (5), hiPSC-neuron (6), and NGN2 (6) (a) or by NRXN1 genotype (control (8), case (9) from 3 donors each) (b). c, Representative confocal images from 2 independent differentiations of control and NRXN1+/− ASCL1/DLX2-GABAergic hiPSC-neurons. d, Expression of glutamatergic, GABAergic and pan-neuronal marker genes across NRXN1+/− (9) and control (8) NGN2-glutamatergic and ASCL1/DLX2-GABAergic hiPSC-neurons. Boxplot shows median and IQR. e, Sum of all NRXN1 transcripts expressed across control (2 donors), 3’-NRXN1+/− (2 donors) and 5’-NRXN1+/− (2 donors) in NGN2-glutamatergic and ASCL1/DLX2-GABAergic hiPSC-neurons. f,g, NRXN1α (f) and NRXN1β (g) isoform usage expressed across control, 3’-NRXN1+/− and 5’-NRXN1+/− donors in NGN2-glutamatergic and ASCL1/DLX2-GABAergic hiPSC-neurons. Boxplot displays median and range with P < 0.01 indicated by “**” from two way ANOVA with Holm-Sidak’s test.
Extended Data Fig. 6. Examination of NRXN1α canonical splice sites and total NRXN1 isoform expression.
a, Pearson’s correlation of NRXN1α isoform expression across control and 3’-NRXN1+/− hiPSC-neurons (n = 99 isoforms, r computed by t-statistics). b,c, Bar plot of the total read count for each NRXN1α exon along with the fraction that each NRXN1α junction is included in control hiPSC-neurons (b) and 3’-NRXN1+/− hiPSC-neurons. Red circle indicates the novel junction created by the 3’-NRXN1+/− deletion (c). d, Schematic of the experimental design to test activity induced regulation at NRXN1α canonical splice sites. e, Fold change of canonical splice site exclusion in controls (gray) and a 3’-NRXN1+/− hiPSC-neuron (red) plus KCl compared to PBS control (dotted line). f, Bar plot showing fold change of SS4 in KCl treated control and 3’-NRXN1+/- hiPSC-neurons (compared to PBS). g, Schematic of the experimental design to test developmental regulation at NRXN1α canonical splice sites. h, Fold change of canonical splice sites in control hiPSC-neurons at 2-weeks (light gray), 4-weeks (gray) and 6-weeks (dark gray) post-differentiation compared to NPCs (dotted line). i, Specific examination of developmental exclusion of SS4. Error bars are s.e. j-m, Expression of levels of all NRXN1 isoforms (j), NRXN1α (k), NRXN1β (l), NRXN1γ (m) across NRXN1 genotypes (8 control, 3 donors; 5 3’-NRXN1+/−, 2 donors; 5 5’-NRXN1+/−, 2 donors) in hiPSC-neurons. Violin plot displays density and range with P < 0.05 indicated by “*” from Wilcoxon Signed Rank Test. n, Pearson’s correlation of all NRXN1 isoforms (18 samples, 6 donors) with NRXN1α, NRXN1β and NRXN1γ (r values calculated using t-statistics).
Extended Data Fig. 7. Single cell expression of synaptic genes.
a, Violin plot displaying density of the expression of NRXN and multiple synaptic marker genes in single cells across control (2 donors) and NRXN1+/− (3 donors) hiPSC-neurons. b, Violin plot displaying density and range of the expression of multiple synaptic genes identified as marker genes in immature neuronal clusters from scRNA-seq data across control (2 donors) and NRXN1+/− (3 donors) hiPSC-neurons.
Extended Data Fig. 8. Investigation of hiPSC-neuron morphology, cellular signaling, and NRXN1 overexpression.
a, Strategy to label individual hiPSC-neurons. b-g, Mean neurite number across genotypes (control 71 neurons, 2 donors; 3’-NRXN1+/− 72 neurons, 2 donors; 5’-NRXN1+/− 50 neurons 2 donors) “****” indicates P < 0.00001 and “***”indicates P < 0.0001 by one-way ANOVA with Holm-Sidak’s test; (b) or by coverslip (2 donors, 12 coverslips, 3 regions each) (c,d) mean neurite length across genotypes (control 71 neurons, 2 donors; 3’-NRXN1+/− 72 neurons, 2 donors; 5’-NRXN1+/- 50 neurons, 2 donors); (e) or by coverslip (2 donors, 12 coverslips, 3 regions each) (f,g). Two donors per genotype indicated by different shading within each plot. h, Differentially active kinases (3’- NRXN1+/− hiPSC-neurons: 6 samples, 2 donors; controls: 5 samples, 2 donors). i, Volcano plot of –log10(P-value) and log2(FoldChange) from linear model of RNA-seq (3’-NRXN1+/− hiPSC-neurons: 5 samples, 2 donors; controls 6 samples, 2 donors); DE kinase associated genes labeled. j, Violin plot of median and quartiles of RPKM for kinase hits with largest fold-change in RNA-seq (3’-NRXN1+/− hiPSC-neurons: 5 samples, 2 donors; controls: 6 samples, 2 donors). k, Differentially active kinases in (5’- NRXN1+/− hiPSC-neurons: 3 samples, 1 donors; controls 5 samples, 2 donors). l, Volcano plot of –log10(P-value) and log2(FoldChange) from linear model of RNA-seq (5’-NRXN1+/− hiPSC-neurons: 3 samples, 1 donors; controls 6 samples, 2 donors); DE kinase associated genes labeled. m, Violin plot of median and quartiles of RPKM for kinase hits with largest fold change values in RNA-seq (5’-NRXN1+/− hiPSC-neurons: 3 samples, 1 donors; controls 6 samples, 2 donors). n, Isoform constructs for overexpression with log2(FoldChange) from hybrid sequencing dataset. o, Mean fold-change from qPCR of NRXN1 expression (3 replicates per condition. p, Representative western blot (2 replicates) for anti-FLAG (48hr expression of control-enriched NRXN1α-FLAG). q, Representative western blot (2 replicates) for anti-FLAG (48hr expression of 3’-NRXN1+/− specific NRXN1α-FLAG). All error bars are s.e.
Extended Data Fig. 9. Predicted protein models for wild-type and mutant NRXN1α isoforms.
a, Superimposed image of the top ten most abundant wildtype NRXN1α isoforms in hiPSC-neurons. b, Superimposed predicted protein model of the top ten most abundant mutant isoforms. c, Superimposed predicted protein model of the top ten most abundant mutant isoforms compared to the most abundant wildtype isoform (grey). d, Individual predicted protein models of the top ten most abundant wild type isoforms. e, Individual predicted protein models of the top ten most abundant mutant isoforms. Insets in each panel highlight C-terminal region of NRXN1α isoforms where 3’-NRXN1+/− deletion is located.
Extended Data Fig. 10. Investigation of NRXN1α isoform changes across development.
a,b, Bar plot of the total read count for each NRXN1α exon along with the fraction that each NRXN1α junction is included in adult dlPFC samples (a) and fetal PFC samples (b); pink boxes represent potential developmentally regulated exons. c, Schematic of NRXN1α isoform structure, with each row representing a unique NRXN1α isoform and each column representing a NRXN1 exon. Colored exons (blue, fetal PFC specific; green, adult dlPFC specific; orange, shared) are spliced into the transcript while blank exons are spliced out. Abundance of each NRXN1α isoform across fetal PFC and adult dlPFC samples.
Supplementary Material
ACKNOWLEDGEMENTS
K.J.B. is a New York Stem Cell Foundation—Robertson Investigator. This work was partially supported by National Institute of Health (NIH) grants R01 MH101454 (K. Brennand), R01 MH106056 (K.J.B.), R01 MH107487 (R.M.) and F31 MH112285 (E.Flaherty.), a Brain and Behavior Research Foundation Independent Investigator Grant (K.J.B.), a Brain Research Foundation Seed Grant (K.J.B.) and the New York Stem Cell Foundation (K.J.B.). We thank the Neuroscience and Stem Cell cores at Icahn School of Medicine at Mount Sinai. This work was supported in part through the computational resources and staff expertise provided by Scientific Computing at the Icahn School of Medicine at Mount Sinai. J. Simon drew the original illustrations used in the schematic shown in Figures 3a and 6a,d,e. We acknowledge the Mount Sinai Neuropathology Research Core and Brain bank (Dr. J. Crary) for providing the human postmortem brain tissue.
Footnotes
COMPETING INTERESTS STATEMENT
The authors declare no competing interests.
DATA AVAILABILITY
To facilitate improved sharing between stem cell laboratories, all hiPSCs have already been deposited at the Rutgers University Cell and DNA Repository (study 160; http://www.nimhstemcells.org/) and all sequencing data has been deposited to GEO (GSE137101 whole short-read RNA-seq and scRNA-seq and GSE137127 targeted short-read RNA-seq) or SRA (PRJNA563972 Iso-seq).
CODE AVAILABILITY
To facilitate improved reproducibility of our data analyses, all code has been deposited at github.com/zhushijia/STAR2bSMRT.
OVERSIGHT
All hiPSC research conducted under the oversight of the Institutional Review Board (IRB) and Embryonic Stem Cell Research Overview (ESCRO) committees at ISSMS.
REFERENCES
- 1.Ching MSL et al. Deletions of NRXN1 (neurexin-1) predispose to a wide spectrum of developmental disorders. Am. J. Med. Genet. Part B Neuropsychiatr. Genet 153, 937–947 (2010). [DOI] [PMC free article] [PubMed] [Google Scholar]
- 2.Marshall CR et al. Contribution of copy number variants to schizophrenia from a genome-wide study of 41,321 subjects. Nat. Genet 49, 27–35 (2017). [DOI] [PMC free article] [PubMed] [Google Scholar]
- 3.Matsunami N et al. Identification of rare recurrent copy number variants in high-risk autism families and their prevalence in a large ASD population. PLoS One 8, e52239 (2013). [DOI] [PMC free article] [PubMed] [Google Scholar]
- 4.Moller RS et al. Exon-disrupting deletions of NRXN1 in idiopathic generalized epilepsy. Epilepsia 54, 256–264 (2013). [DOI] [PubMed] [Google Scholar]
- 5.Lowther C et al. Molecular characterization of NRXN1 deletions from 19,263 clinical microarray cases identifies exons important for neurodevelopmental disease expression. Genet. Med. 19, 53–61 (2017). [DOI] [PMC free article] [PubMed] [Google Scholar]
- 6.Etherton MR, Blaiss CA, Powell CM & Südhof TC Mouse neurexin-1alpha deletion causes correlated electrophysiological and behavioral changes consistent with cognitive impairments. Proc. Natl. Acad. Sci. USA 106, 17998–18003 (2009). [DOI] [PMC free article] [PubMed] [Google Scholar]
- 7.Grayton HM, Missler M, Collier DA & Fernandes C Altered social behaviours in Neurexin 1α knockout mice resemble core symptoms in neurodevelopmental disorders. PLoS One 8, e67114 (2013). [DOI] [PMC free article] [PubMed] [Google Scholar]
- 8.Missler M et al. Alpha-neurexins couple Ca2+ channels to synaptic vesicle exocytosis. Nature 423, 939–948 (2003). [DOI] [PubMed] [Google Scholar]
- 9.Pak C et al. Human neuropsychiatric disease modeling using conditional deletion reveals synaptic transmission defects caused by heterozygous mutations in NRXN1. Cell Stem Cell 17, 316–328 (2015). [DOI] [PMC free article] [PubMed] [Google Scholar]
- 10.Jenkins AK et al. Neurexin 1 (NRXN1) splice isoform expression during human neocortical development and aging. Mol. Psychiatry 21, 701–706 (2016). [DOI] [PMC free article] [PubMed] [Google Scholar]
- 11.Harkin LF et al. Neurexins 1–3 each have a distinct pattern of expression in the early developing human cerebral cortex. Cereb. Cortex 27, 1–17 (2016). [DOI] [PMC free article] [PubMed] [Google Scholar]
- 12.Treutlein B, Gokce O, Quake SR & Südhof TC Cartography of neurexin alternative splicing mapped by single-molecule long-read mRNA sequencing. Proc. Natl. Acad. Sci. USA 111, E1291–E1299 (2014). [DOI] [PMC free article] [PubMed] [Google Scholar]
- 13.Schreiner D et al. Targeted combinatorial alternative splicing generates brain region-specific repertoires of neurexins. Neuron 84, 386–398 (2014). [DOI] [PubMed] [Google Scholar]
- 14.Nguyen T-M et al. An alternative splicing switch shapes neurexin repertoires in principal neurons versus interneurons in the mouse hippocampus. Elife 5, e22757 (2016). [DOI] [PMC free article] [PubMed] [Google Scholar]
- 15.Fuccillo MV et al. Single-cell mRNA profiling reveals cell-type-specific expression of neurexin isoforms. Neuron 87, 326–340 (2015). [DOI] [PMC free article] [PubMed] [Google Scholar]
- 16.Traunmuller L, Gomez AM, Nguyen T-M & Scheiffele P Control of neuronal synapse specification by a highly dedicated alternative splicing program. Science 352, 982–986 (2016). [DOI] [PubMed] [Google Scholar]
- 17.Au KF, Underwood JG, Lee L & Wong WH Improving PacBio long read accuracy by short read alignment. PLoS One 7, 1–8 (2012). [DOI] [PMC free article] [PubMed] [Google Scholar]
- 18.Au KF et al. Characterization of the human ESC transcriptome by hybrid sequencing. Proc. Natl. Acad. Sci. USA 110, E4821–E4830 (2013). [DOI] [PMC free article] [PubMed] [Google Scholar]
- 19.Ahn K, An SS, Shugart YY & Rapoport JL Common polygenic variation and risk for childhood-onset schizophrenia. Mol. Psychiatry 21, 94–96 (2016). [DOI] [PubMed] [Google Scholar]
- 20.Ahn K et al. High rate of disease-related copy number variations in childhood onset schizophrenia. Mol. Psychiatry 19, 568–572 (2014). [DOI] [PMC free article] [PubMed] [Google Scholar]
- 21.Sudhof TC Synaptic neurexin complexes: a molecular code for the logic of neural circuits. Cell 171, 745–769 (2017). [DOI] [PMC free article] [PubMed] [Google Scholar]
- 22.Brennand KJ et al. Modelling schizophrenia using human induced pluripotent stem cells. Nature 479, 556–556 (2011). [DOI] [PMC free article] [PubMed] [Google Scholar]
- 23.Brennand K et al. Phenotypic differences in hiPSC NPCs derived from patients with schizophrenia. Mol. Psychiatry 20, 361–368 (2014). [DOI] [PMC free article] [PubMed] [Google Scholar]
- 24.Hoffman GE et al. Transcriptional signatures of schizophrenia in hiPSC-derived NPCs and neurons are concordant with post-mortem adult brains. Nat. Commun 8, 2225 (2017). [DOI] [PMC free article] [PubMed] [Google Scholar]
- 25.Topol A, Tran NN & Brennand KJ A guide to generating and using hiPSC derived NPCs for the study of neurological diseases. J. Vis. Exp e52495 (2015). [DOI] [PMC free article] [PubMed] [Google Scholar]
- 26.Ho S, Topol A & Brennand KJ From ‘Directed Differentiation’ to ‘Neuronal Induction’: modeling neuropsychiatric disease. Biomark. Insights 10, 31 (2015). [DOI] [PMC free article] [PubMed] [Google Scholar]
- 27.Yang N et al. Generation of pure GABAergic neurons by transcription factor programming. Nat. Methods 14, 621–628 (2017). [DOI] [PMC free article] [PubMed] [Google Scholar]
- 28.Ballouz S & Gillis J Strength of functional signature correlates with effect size in autism. Genome Med 9, 64 (2017). [DOI] [PMC free article] [PubMed] [Google Scholar]
- 29.Fromer M et al. De novo mutations in schizophrenia implicate synaptic networks. Nature 506, 179–184 (2014). [DOI] [PMC free article] [PubMed] [Google Scholar]
- 30.Purcell SM et al. A polygenic burden of rare disruptive mutations in schizophrenia. Nature 506, 185–90 (2014). [DOI] [PMC free article] [PubMed] [Google Scholar]
- 31.Sanders SJ et al. Insights into autism spectrum disorder genomic architecture and biology from 71 risk loci. Neuron 87, 1215–1233 (2015). [DOI] [PMC free article] [PubMed] [Google Scholar]
- 32.Network and Pathway Analysis Subgroup of Psychiatric Genomics Consortium. Psychiatric genome-wide association study analyses implicate neuronal, immune and histone pathways. Nat. Neurosci 18, 199–209 (2015). [DOI] [PMC free article] [PubMed] [Google Scholar]
- 33.Fromer M et al. Gene expression elucidates functional impact of polygenic risk for schizophrenia. Nat. Neurosci 19, 1442–1453 (2016). [DOI] [PMC free article] [PubMed] [Google Scholar]
- 34.Gandal MJ et al. Shared molecular neuropathology across major psychiatric disorders parallels polygenic overlap. Science 359, 693–697 (2018). [DOI] [PMC free article] [PubMed] [Google Scholar]
- 35.Ripke S et al. Biological insights from 108 schizophrenia-associated genetic loci. Nature 511, 421–427 (2014). [DOI] [PMC free article] [PubMed] [Google Scholar]
- 36.Steijger T et al. Assessment of transcript reconstruction methods for RNA-seq. Nat. Methods 10, 1177–1184 (2013). [DOI] [PMC free article] [PubMed] [Google Scholar]
- 37.Zhang Y et al. Rapid single-step induction of functional neurons from human pluripotent stem cells. Neuron 78, 785–798 (2013). [DOI] [PMC free article] [PubMed] [Google Scholar]
- 38.Ho SM et al. Rapid Ngn2-induction of excitatory neurons from hiPSC-derived neural progenitor cells. Methods 101, 113–124 (2016). [DOI] [PMC free article] [PubMed] [Google Scholar]
- 39.Aoto J, Martinelli DC, Malenka RC, Tabuchi K & Südhof TC Presynaptic Neurexin-3 Alternative Splicing trans-Synaptically Controls Postsynaptic AMPA Receptor Trafficking. Cell 154, 75–88 (2013). [DOI] [PMC free article] [PubMed] [Google Scholar]
- 40.Aoto J, Földy C, Ilcus SMC, Tabuchi K & Südhof TC Distinct circuit-dependent functions of presynaptic neurexin-3 at GABAergic and glutamatergic synapses. Nat. Neurosci 18, 997–1007 (2015). [DOI] [PMC free article] [PubMed] [Google Scholar]
- 41.Graf ER, Zhang X, Jin S-XX, Linhoff MW & Craig AM Neurexins induce differentiation of GABA and glutamate postsynaptic specializations via neuroligins. Cell 119, 1013–1026 (2004). [DOI] [PMC free article] [PubMed] [Google Scholar]
- 42.Uemura T et al. Trans-synaptic interaction of GluRdelta2 and Neurexin through Cbln1 mediates synapse formation in the cerebellum. Cell 141, 1068–1079 (2010). [DOI] [PubMed] [Google Scholar]
- 43.Pettem KL et al. The specific alpha-neurexin interactor calsyntenin-3 promotes excitatory and inhibitory synapse development. Neuron 80, 113–128 (2013). [DOI] [PMC free article] [PubMed] [Google Scholar]
- 44.Linhoff MW et al. An unbiased expression screen for synaptogenic proteins identifies the LRRTM protein family as synaptic organizers. Neuron 61, 734–749 (2009). [DOI] [PMC free article] [PubMed] [Google Scholar]
- 45.Scheiffele P, Fan J, Choih J, Fetter R & Serafini T Neuroligin expressed in nonneuronal cells triggers presynaptic development in contacting axons. Cell 101, 657–669 (2000). [DOI] [PubMed] [Google Scholar]
- 46.Anderson GR et al. beta-neurexins control neural circuits by regulating synaptic endocannabinoid signaling. Cell 162, 593–606 (2015). [DOI] [PMC free article] [PubMed] [Google Scholar]
- 47.Quinn DP et al. Pan-neurexin perturbation results in compromised synapse stability and a reduction in readily releasable synaptic vesicle pool size. Sci. Rep 7, 42920 (2017). [DOI] [PMC free article] [PubMed] [Google Scholar]
- 48.Mountoufaris G, Canzio D, Nwakeze CL, Chen WV & Maniatis T Writing, reading, and translating the clustered protocadherin cell surface recognition code for neural circuit assembly. Annu. Rev. Cell Dev. Biol 34, 471–493 (2018). [DOI] [PubMed] [Google Scholar]
- 49.Ding X et al. Activity-induced histone modifications govern Neurexin-1 mRNA splicing and memory preservation. Nat. Neurosci 20, 690–699 (2017). [DOI] [PubMed] [Google Scholar]
- 50.Rozic G, Lupowitz Z, Piontkewitz Y & Zisapel N Dynamic changes in neurexins’ alternative splicing: Role of rho-associated protein kinases and relevance to memory formation. PLoS One 6, e18579 (2011). [DOI] [PMC free article] [PubMed] [Google Scholar]
- 51.Iijima T et al. SAM68 regulates neuronal activity-dependent alternative splicing of neurexin-1. Cell 147, 1601–1614 (2011). [DOI] [PMC free article] [PubMed] [Google Scholar]
- 52.Boucard AA, Chubykin AA, Comoletti D, Taylor P & Sudhof TC A splice code for trans-synaptic cell adhesion mediated by binding of neuroligin 1 to alpha- and beta-neurexins. Neuron 48, 229–236 (2005). [DOI] [PubMed] [Google Scholar]
- 53.Chih B, Gollan L & Scheiffele P Alternative splicing controls selective trans-synaptic interactions of the neuroligin-neurexin complex. Neuron 51, 171–178 (2006). [DOI] [PubMed] [Google Scholar]
- 54.Ko J, Fuccillo MV, Malenka RC & Südhof TC LRRTM2 functions as a neurexin ligand in promoting excitatory synapse formation. Neuron 64, 791–798 (2009). [DOI] [PMC free article] [PubMed] [Google Scholar]
- 55.Siddiqui TJ, Pancaroglu R, Kang Y, Rooyakkers A & Craig AM LRRTMs and neuroligins bind neurexins with a differential code to cooperate in glutamate synapse development. J. Neurosci 30, 7495–7506 (2010). [DOI] [PMC free article] [PubMed] [Google Scholar]
- 56.Boucard A. a., Ko J & Südhof TC High affinity neurexin binding to cell adhesion G-protein-coupled receptor CIRL1/latrophilin-1 produces an intercellular adhesion complex. J. Biol. Chem 287, 9399–9413 (2012). [DOI] [PMC free article] [PubMed] [Google Scholar]
- 57.Marshall CR et al. Contribution of copy number variants to schizophrenia from a genome-wide study of 41,321 subjects. Nat. Genet 49, 27–35 (2017). [DOI] [PMC free article] [PubMed] [Google Scholar]
- 58.Germain PL & Testa G Taming human genetic variability: transcriptomic meta-analysis guides the experimental design and interpretation of iPSC-based disease modeling. Stem Cell Reports 8, 1784–1796 (2017). [DOI] [PMC free article] [PubMed] [Google Scholar]
- 59.Zhao D et al. MicroRNA profiling of neurons generated using induced pluripotent stem cells derived from patients with schizophrenia and schizoaffective disorder, and 22q11.2 Del. PLoS One 10, e0132387 (2015). [DOI] [PMC free article] [PubMed] [Google Scholar]
- 60.Marchetto MCN et al. A model for neural development and treatment of Rett syndrome using human induced pluripotent stem cells. Cell 143, 527–539 (2010). [DOI] [PMC free article] [PubMed] [Google Scholar]
- 61.Shcheglovitov A et al. SHANK3 and IGF1 restore synaptic deficits in neurons from 22q13 deletion syndrome patients. Nature 503, 267–271 (2013). [DOI] [PMC free article] [PubMed] [Google Scholar]
- 62.Krey JF et al. Timothy syndrome is associated with activity-dependent dendritic retraction in rodent and human neurons. Nat. Neurosci 16, 201–209 (2013). [DOI] [PMC free article] [PubMed] [Google Scholar]
- 63.Wen Z et al. Synaptic dysregulation in a human iPS cell model of mental disorders. Nature 515, 414–418 (2014). [DOI] [PMC free article] [PubMed] [Google Scholar]
- 64.Deshpande A et al. Cellular phenotypes in human iPSC-derived neurons from a genetic model of autism spectrum disorder. Cell Rep 21, 2678–2687 (2017). [DOI] [PMC free article] [PubMed] [Google Scholar]
- 65.Yeh E et al. Patient-derived iPSCs show premature neural differentiation and neuron type-specific phenotypes relevant to neurodevelopment. Mol. Psychiatry 23, 1687–1698 (2018). [DOI] [PMC free article] [PubMed] [Google Scholar]
- 66.Chen SX, Tari PK, She K & Haas K Neurexin-neuroligin cell adhesion complexes contribute to synaptotropic dendritogenesis via growth stabilization mechanisms in vivo. Neuron 67, 967–983 (2010). [DOI] [PubMed] [Google Scholar]
- 67.Dudanova I et al. Deletion of alpha-neurexins does not cause a major impairment of axonal pathfinding or synapse formation. J. Comp. Neurol 502, 261–274 (2007). [DOI] [PubMed] [Google Scholar]
- 68.Subramanian A et al. Gene set enrichment analysis: A knowledge-based approach for interpreting genome-wide expression profiles. Proc. Natl. Acad. Sci. USA 102, 15545–15550 (2005). [DOI] [PMC free article] [PubMed] [Google Scholar]
- 69.Gandal MJ et al. Shared molecular neuropathology across major psychiatric disorders parallels polygenic overlap. Science 359, 693–697 (2018). [DOI] [PMC free article] [PubMed] [Google Scholar]
METHODS-ONLY REFERENCES
- 70.Roussos P et al. A role for noncoding variation in schizophrenia. Cell Rep 9, 1417–1429 (2014). [DOI] [PMC free article] [PubMed] [Google Scholar]
- 71.Kelley LA, Mezulis S, Yates CM, Wass MN & Sternberg MJE The Phyre2 web portal for protein modeling, prediction and analysis. Nat. Protoc 10, 845–858 (2015). [DOI] [PMC free article] [PubMed] [Google Scholar]
- 72.Dobin A et al. STAR: Ultrafast universal RNA-seq aligner. Bioinformatics 29, 15–21 (2013). [DOI] [PMC free article] [PubMed] [Google Scholar]
- 73.Liao Y, Smyth GK & Shi W featureCounts: an efficient general purpose program for assigning sequence reads to genomic features. Bioinformatics 30, 923–930 (2014). [DOI] [PubMed] [Google Scholar]
- 74.Bray NL, Pimentel H, Melsted P & Pachter L Near-optimal probabilistic RNA-seq quantification. Nat. Biotechnol. 34, 525–527 (2016). [DOI] [PubMed] [Google Scholar]
- 75.Hoffman GE & Schadt EE variancePartition: interpreting drivers of variation in complex gene expression studies. BMC Bioinformatics 17, 483 (2016). [DOI] [PMC free article] [PubMed] [Google Scholar]
- 76.Newman AM et al. Robust enumeration of cell subsets from tissue expression profiles. Nat. Methods 12, 453–457 (2015). [DOI] [PMC free article] [PubMed] [Google Scholar]
- 77.Ritchie ME et al. Limma powers differential expression analyses for RNA-sequencing and microarray studies. Nucleic Acids Res 43, e47 (2015). [DOI] [PMC free article] [PubMed] [Google Scholar]
- 78.de Leeuw CA, Mooij JM, Heskes T & Posthuma D MAGMA: Generalized Gene-Set Analysis of GWAS Data. PLoS Comput. Biol 11, 1–19 (2015). [DOI] [PMC free article] [PubMed] [Google Scholar]
- 79.Kuleshov MV et al. Enrichr: a comprehensive gene set enrichment analysis web server 2016 update. Nucleic Acids Res 44, W90–W97 (2016). [DOI] [PMC free article] [PubMed] [Google Scholar]
- 80.Chen L & Zheng S Studying alternative splicing regulatory networks through partial correlation analysis. Genome Biol 10, R3 (2009). [DOI] [PMC free article] [PubMed] [Google Scholar]
- 81.Zhu S, Wang G, Liu B & Wang Y Modeling exon expression using histone modifications. PLoS One 8, e67448 (2013). [DOI] [PMC free article] [PubMed] [Google Scholar]
- 82.Wang L, Feng Z, Wang X, Wang X & Zhang X DEGseq: an R package for identifying differentially expressed genes from RNA-seq data. Bioinformatics 26, 136–138 (2010). [DOI] [PubMed] [Google Scholar]
- 83.Dorsett CR et al. Traumatic brain injury induces alterations in cortical glutamate uptake without a reduction in glutamate transporter-1 protein expression. J. Neurotrauma 34, 220–234 (2017). [DOI] [PMC free article] [PubMed] [Google Scholar]
- 84.Mcguire JL et al. Abnormalities of signal transduction networks in chronic schizophrenia. npj Schizophr 3, 30 (2017). [DOI] [PMC free article] [PubMed] [Google Scholar]
- 85.Appuhamy JA et al. Effects of AMP-activated protein kinase (AMPK) signaling and essential amino acids on mammalian target of rapamycin (mTOR) signaling and protein synthesis rates in mammary cells. J. Dairy Sci. 97, 419–429 (2013). [DOI] [PubMed] [Google Scholar]
Associated Data
This section collects any data citations, data availability statements, or supplementary materials included in this article.


