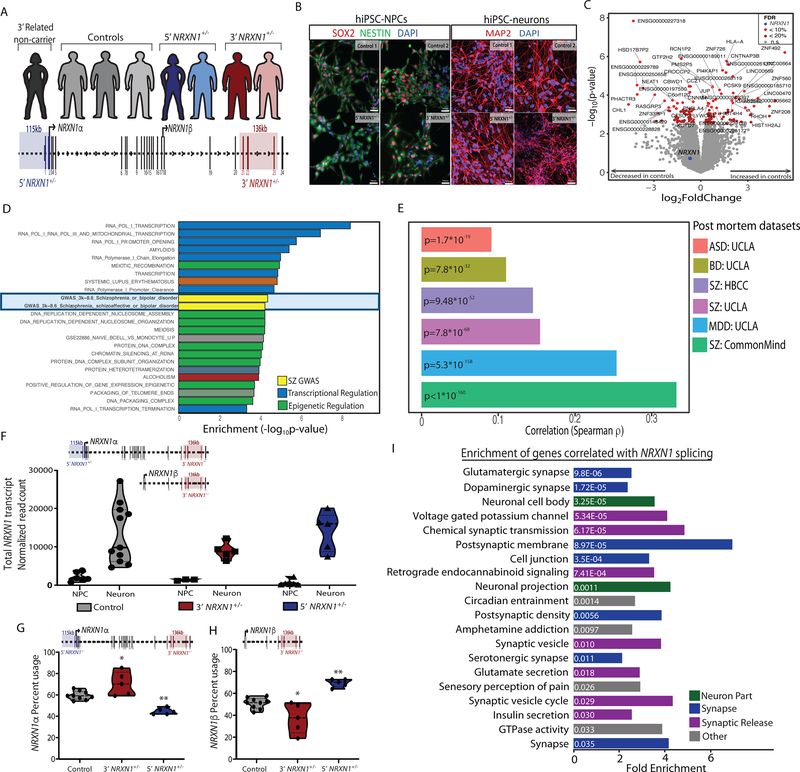
Figure 1 |. Cohort description and transcriptomic analysis.
a, Representation of individuals in the hiPSC cohort used for this study (5’-NRXN1+/− deletions in blue; 3’-NRXN1+/− deletions in red; controls in gray) with schematic of the NRXN1 gene structure highlighting the exons encompassed by 5’-(blue) and 3’-(red) NRXN1+/− deletions. b, Validation of hiPSC-derived neural cells by immunostaining for SOX2 and NESTIN (NPCs) and MAP2 (6-week hiPSC-neurons) with DAPI stained nuclei, 3 independent differentiations per line. c, Volcano plot showing log2(foldchange) between NRXN1+/− (18 samples, 4 donors) and controls (19 samples, 4 donors) and the –log10(P-value) by linear model for each gene with FDR < 20% in red, FDR < 10% in orange and NRXN1 in blue. d, Gene set enrichment analysis, with –log10(P-value) computed by Fisher Exact test using mSigDB68. e, Concordance computed using Spearman correlation of the t-statistics between two datasets. Comparisons were made between this study and postmortem RNA-seq datasets of schizophrenia (SZ), major depressive disorder (MDD), bipolar disorder (BD), and autism spectrum disorder (ASD) from CommonMind33, NIMH HBCC and UCLA69. f, Sum of all NRXN1 transcript expression by cell type (19 samples, 8 donors hiPSC-NPC; 18 samples, 8 donors hiPSC-neurons) and genotype (19 samples, 4 donors controls; 10 samples, 2 donors 5’-NRXN1+/−; 8 samples, 3 donors 3’-NRXN1+/−). g,h, Differential isoform usage in hiPSC-neurons across genotypes (9 samples, 3 donors controls; 5 samples, 2 donors 5’-NRXN1+/−; 5 samples, 2 donors 3’-NRXN1+/−) when sub-setting for NRXN1α isoforms (g) or NRXN1β isoforms (h). Violin plots display median and quartiles (*P < 0.05, **P < 0.01 by one-way ANOVA with Dunnett’s Test). i, Gene set enrichments for genes correlated with NRXN1 spicing in hiPSC-neurons.

