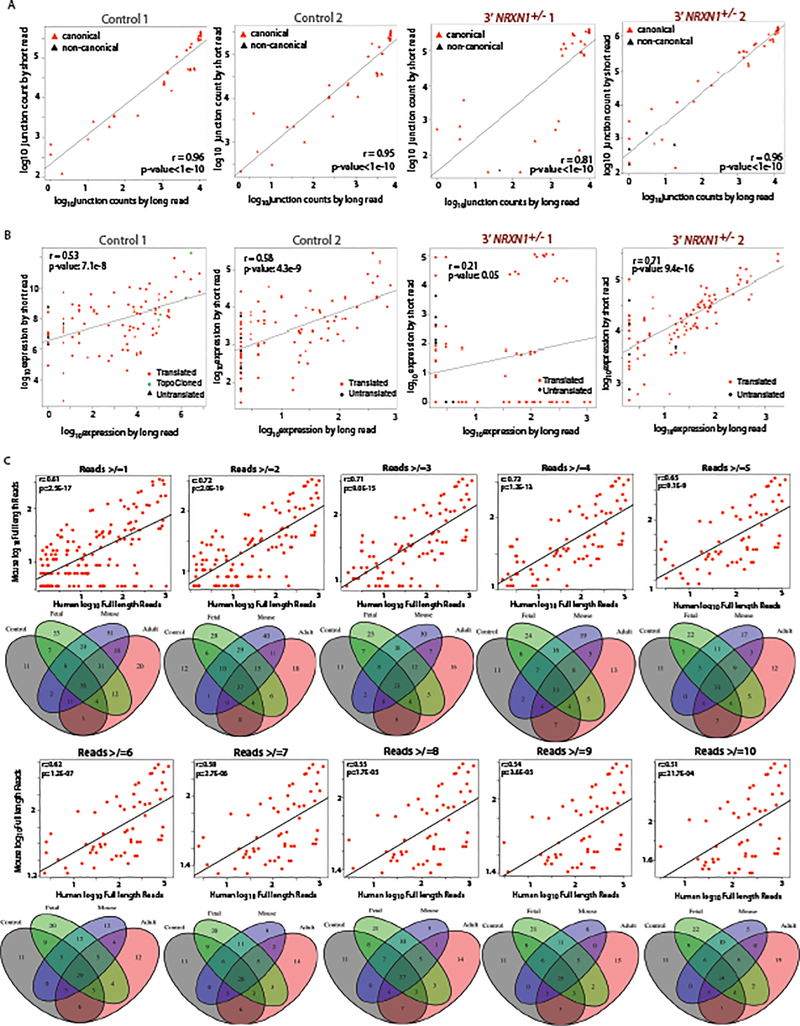
Extended Data Fig. 4. Comparison of long and short read data for quantification and threshold testing.
a, Correlation of NRXN1α junction expression from long read and short read sequencing across control (control 1 n = 39, control 2 n = 37) and 3’-NRXN1+/− (3’-NRXN1+/− 1 n = 36, 3’-NRXN1+/− 2 n = 45) hiPSC-neuron samples. Red triangles represent canonical junctions while black represent non-canonical. b, Correlation of NRXN1α isoform expression from long read quantification and short read quantification across control (Control 1 n = 90, Control 2 n = 88) and 3’-NRXN1+/− (3’-NRXN1+/− 1 n = 89, 3’-NRXN1+/− 2 n = 96) hiPSC-neuron samples. Colored triangles represent in-frame isoforms, predicted to be translated (red), untranslated (black) and TOPO cloned (green). c, Correlation of mouse and human NRXN1α isoform expression and corresponding Venn diagrams for the number of isoforms across expression thresholds (≥2 n = 112, ≥3 n = 88, ≥4 n = 75, ≥5 n = 63, ≥6 n = 60, ≥7 n = 57, ≥8 n = 54, ≥9 n = 52, ≥10 n = 50).

