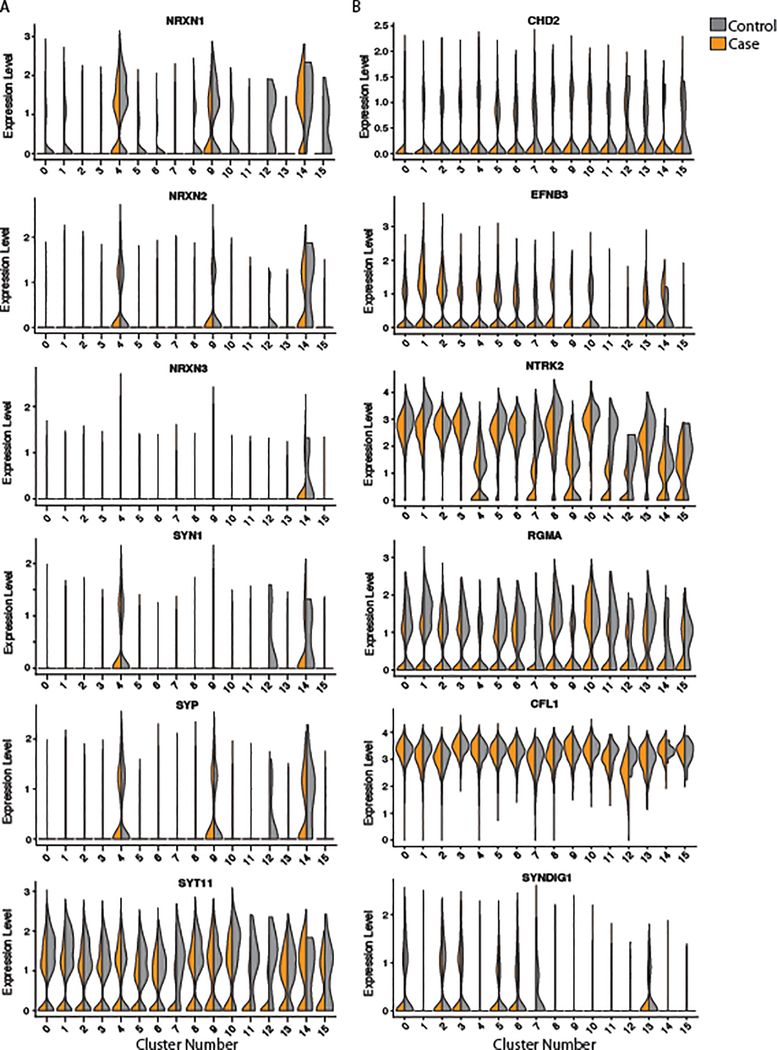
Extended Data Fig. 7. Single cell expression of synaptic genes.
a, Violin plot displaying density of the expression of NRXN and multiple synaptic marker genes in single cells across control (2 donors) and NRXN1+/− (3 donors) hiPSC-neurons. b, Violin plot displaying density and range of the expression of multiple synaptic genes identified as marker genes in immature neuronal clusters from scRNA-seq data across control (2 donors) and NRXN1+/− (3 donors) hiPSC-neurons.

