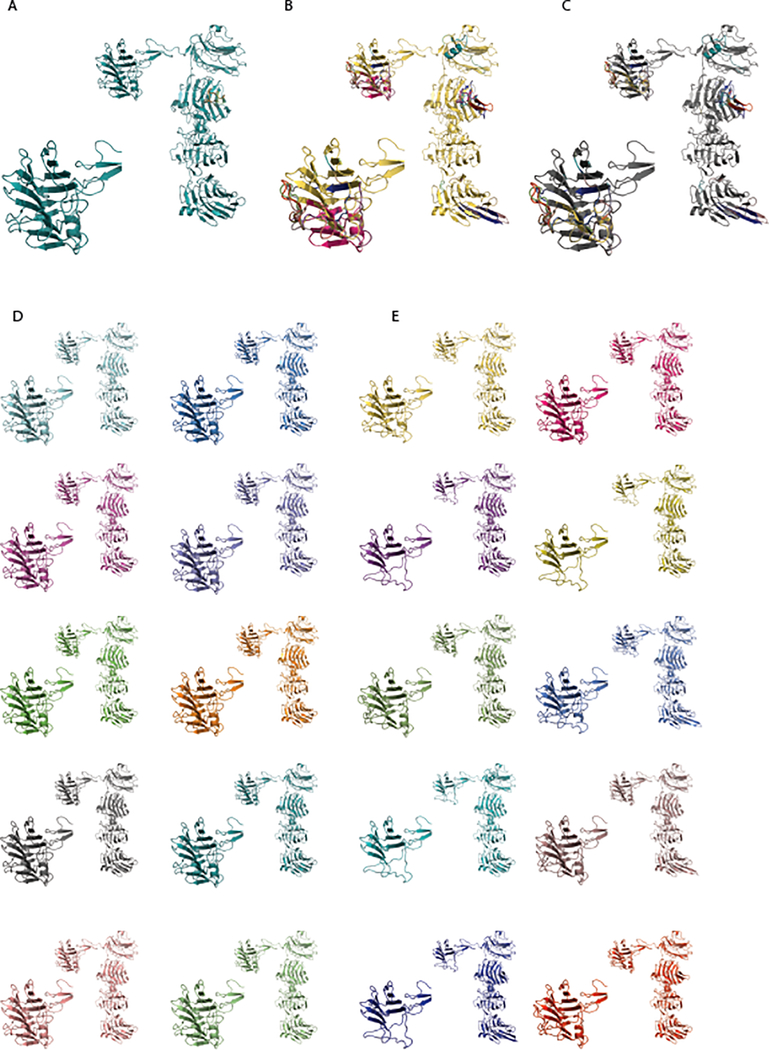
Extended Data Fig. 9. Predicted protein models for wild-type and mutant NRXN1α isoforms.
a, Superimposed image of the top ten most abundant wildtype NRXN1α isoforms in hiPSC-neurons. b, Superimposed predicted protein model of the top ten most abundant mutant isoforms. c, Superimposed predicted protein model of the top ten most abundant mutant isoforms compared to the most abundant wildtype isoform (grey). d, Individual predicted protein models of the top ten most abundant wild type isoforms. e, Individual predicted protein models of the top ten most abundant mutant isoforms. Insets in each panel highlight C-terminal region of NRXN1α isoforms where 3’-NRXN1+/− deletion is located.

