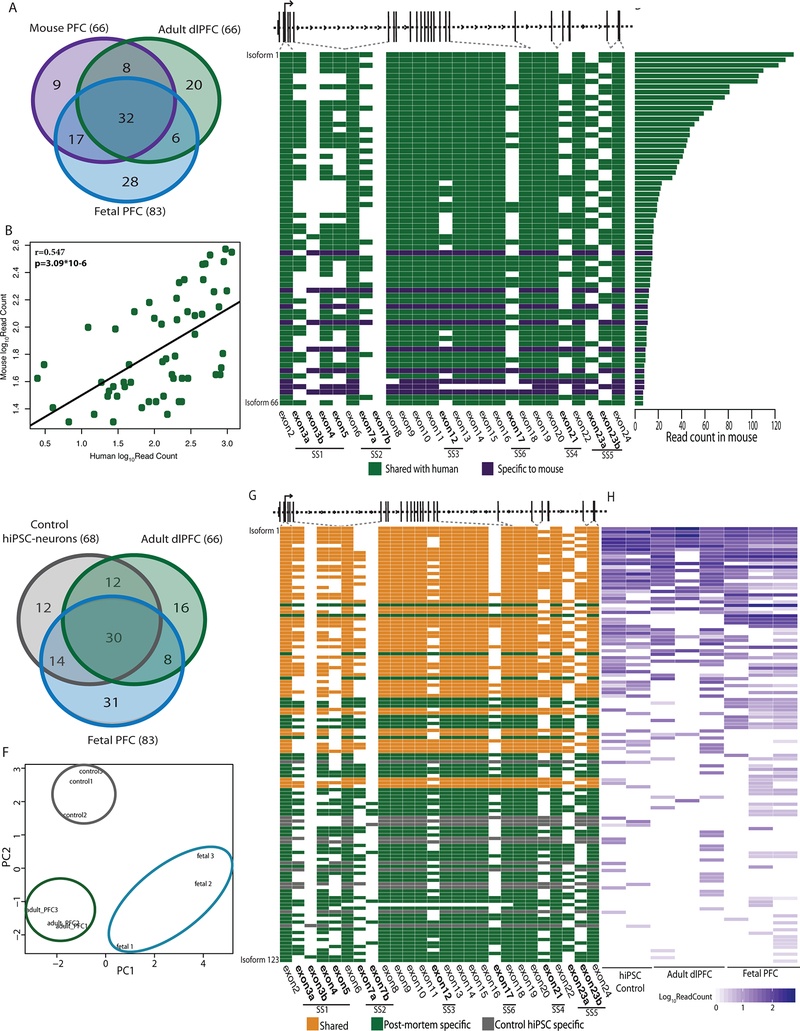
Figure 2 |. Conservation of NRXN1α isoforms across mouse PFC, postmortem PFC and hiPSC-neurons.
a, Overlap of NRXN1α isoforms identified in mouse PFC (1 sample), adult dlPFC (3 donors) and fetal PFC (3 donors). b, Pearson’s correlation of the abundance of 57 NRXN1α isoforms shared between mouse (1 sample) and human (7 samples) with two-sized t-test. c, Schematic of NRXN1α isoform structure, with each row representing a unique NRXN1α isoform and each column representing a NRXN1α exon. Colored exons (green, shared; purple, mouse specific) are spliced into the transcript while blank exons are spliced out. d, Read count for each NRXN1α isoform in mouse PFC. e, Overlap of NRXN1α isoforms identified in adult dlPFC (3 donors), fetal PFC (3 donors) and control hiPSC-neurons (2 donors). f, PCA of NRXN1α isoforms across adult postmortem (3 donors), fetal postmortem (3 donors) and hiPSC-neuron samples (3 donors). g, Schematic of NRXN1α isoform structure, with each row representing a unique NRXN1α isoform and each column representing a NRXN1 exon. Colored exons (orange, shared; green, postmortem specific; gray, hiPSC-neuron specific) are spliced into the transcript while blank exons are spliced out. h, Abundance of each NRXN1α isoform by sample.

