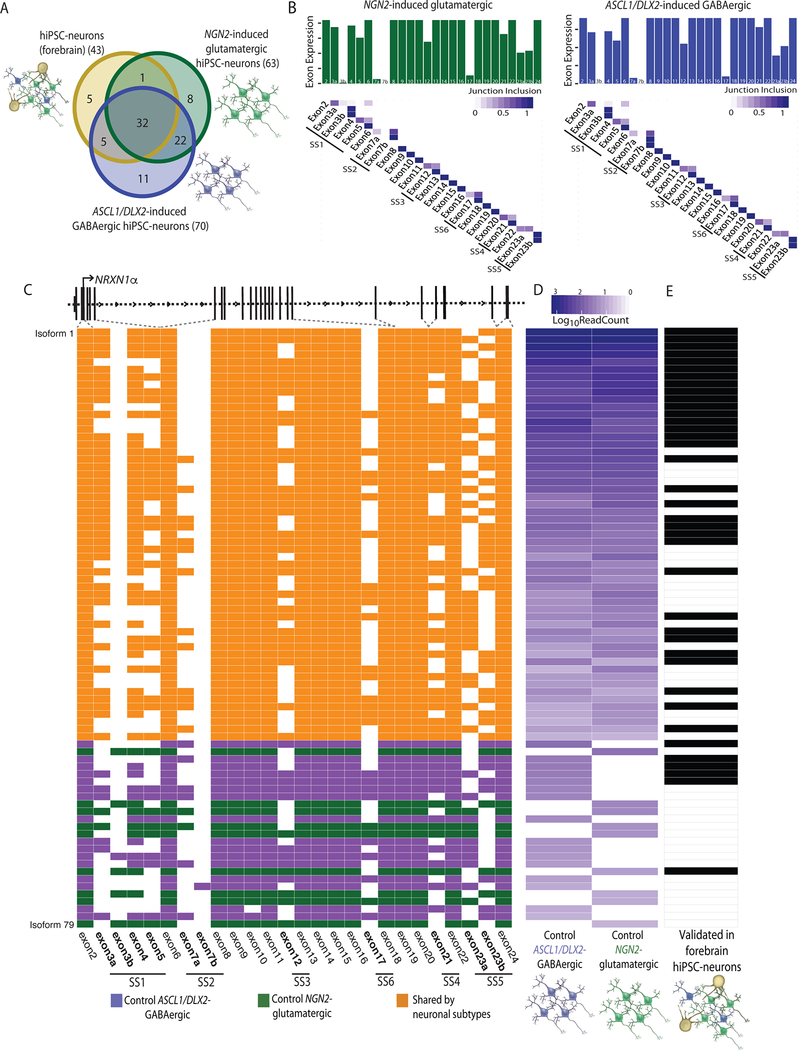
Figure 3 |. Identification of cell type specific NRXN1 isoforms from control isogenic hiPSC-neuronal subtypes.
a, Overlap of NRXN1α isoforms identified in forebrain hiPSC-neurons (3 donors), NGN2-glutamatergic hiPSC-neurons (1 donor) and ASCL1/DLX2-GABAergic hiPSC-neurons (1 donor). b, Bar plot of the total read count for each NRXN1α exon along with the fraction that each NRXN1α junction (row, 5’ end; column, 3’ end) is included in control NGN2-glutamatergic hiPSC-neurons (green, left) and control ASCL1/DLX2-GABAergic hiPSC-neurons (blue, right). c, Schematic of NRXN1α isoform structure, with each row representing a unique NRXN1α isoform and each column representing a NRXN1 exon. Colored exons (blue, ASCL1/DLX2-GABAergic specific, green, NGN2-glutamatergic specific; orange, shared) are spliced into the transcript while blank exons are spliced out. d, Abundance of each NRXN1α isoform across control isogenic hiPSC-neuronal subtypes. e, Validation of each isoform in control forebrain hiPSC-neurons (black, expressed).

