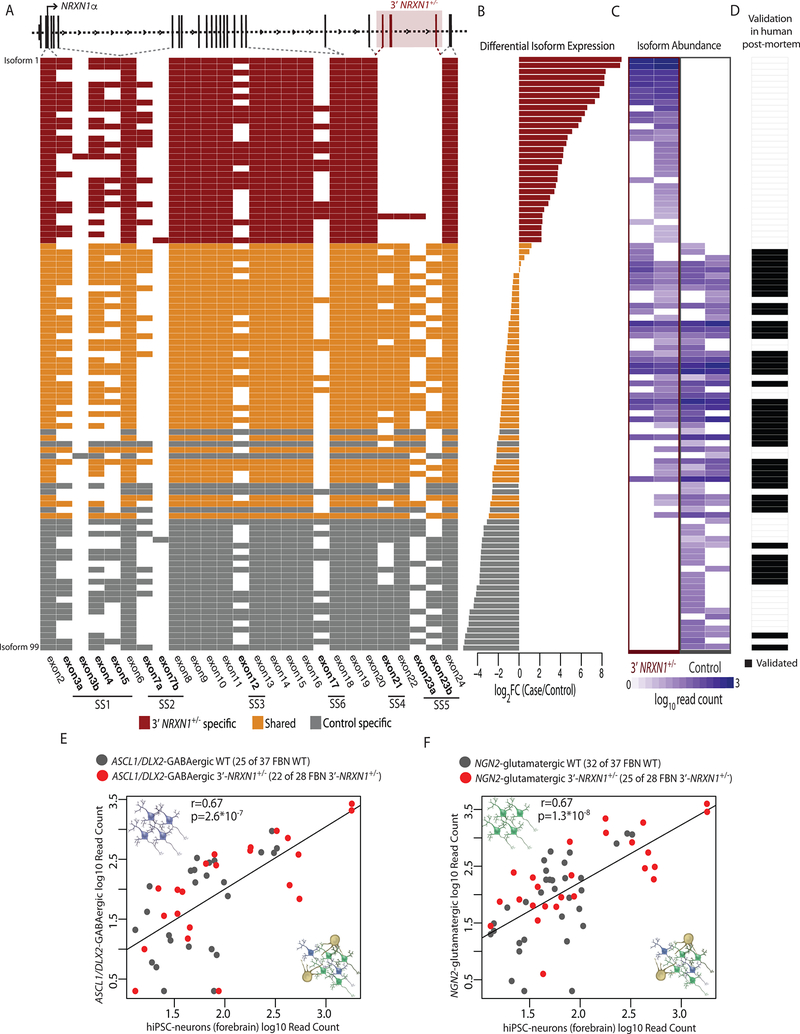
Figure 4 |. Identification of mutant NRXN1α isoforms.
a, Schematic of NRXN1α isoform structure, with each row representing a unique NRXN1α isoform and each column representing a NRXN1 exon. Colored exons (red, 3’-NRXN1+/− specific; gray, control specific; orange, shared) are spliced into the transcript while blank exons are spliced out. b, log2(foldchange) of each NRXN1α isoform in 3’-NRXN1+/− hiPSC-neurons (2 donors) compared to control hiPSC-neurons (2 donors). c, Abundance of each NRXN1α isoform across 3’-NRXN1+/− and control hiPSC-neurons. d, Validation of each isoform in postmortem samples (black, expressed in postmortem PFC). e, Pearson’s correlation of 47 NRXN1α isoforms between hiPSC-neurons (forebrain) and ASCL1/DLX2-GABAergic neurons from 3’-NRXN1+/− (1 donor) and controls (1 donor) with two-sized t-test. f, Pearson’s correlation of 57 NRXN1α isoforms between hiPSC-neurons (forebrain) and NGN2-glutamatergic neurons from 3’-NRXN1+/− (1 donor) and controls (1 donor) with two-sized t-test.

