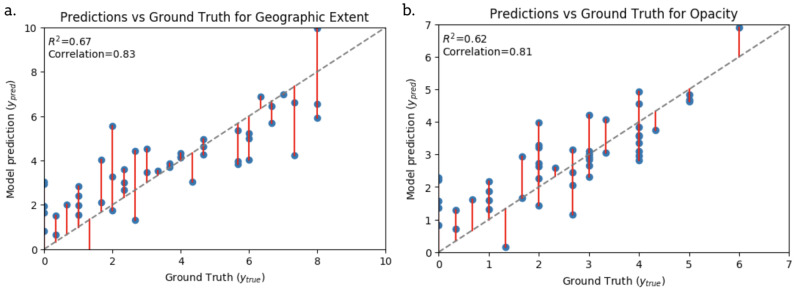
Figure 2. Scatter plots showing alignment between our best model predictions and human annotation (ground truth) for Geographical Extent and Opacity scores.
Evaluation is on a hold out test set. The grey dashed line is a perfect prediction. Red lines indicate error from a perfect prediction.
R2: coefficient of determination.

