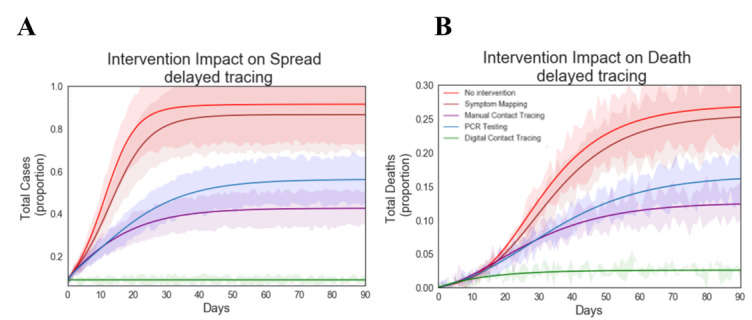
Figure 6.

Effect of tracing delays on intervention performance. A: total cases (proportion) over time. B: total deaths (proportion) over time. Simulations were performed for all intervention groups using initial seeding conditions: 10 cases (40% presymptomatic and 60% symptomatic cases). Time delay to trace for digital contact tracing (0.1 days), symptom-based mapping (3 days), manual contact tracing (4 days), and PCR testing (3 days). Simulations were performed to measure the number of total cases and deaths as a function of time for all intervention groups: digital contact tracing, PCR testing, manual contact tracing, symptom-based monitoring, and no intervention. PCR: polymerase chain reaction.
