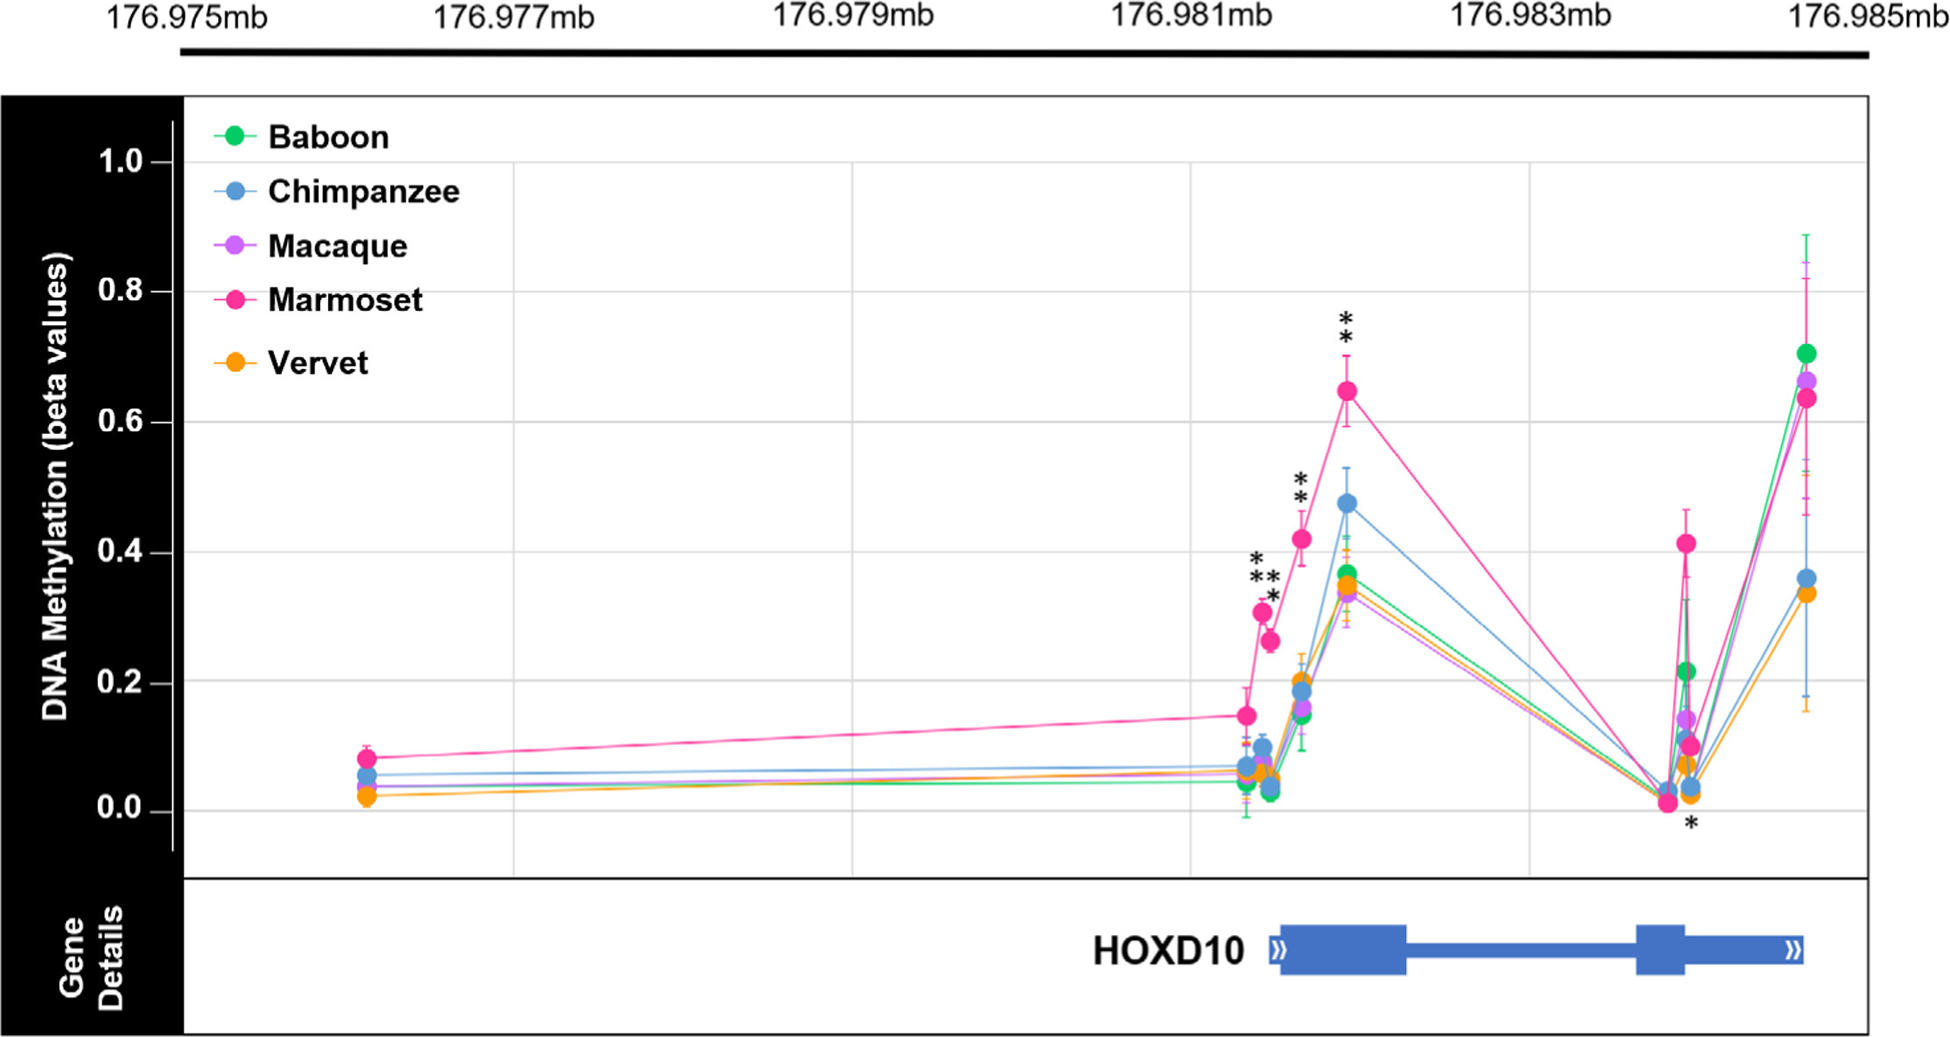
FIGURE 5.

Genome-wide methylation levels across HOXD10 in nonhuman primates. Plot of the methylation levels of significant DMPs across the HOXD10 gene (hg19 chr2:176,981,492–176,984,670). Plot shows the average β values for each DMP with error bars indicating 1 SD in each direction for each comparative group (teal = baboon, orange = chimpanzee, purple = macaque, pink = marmoset, and light green = vervet). DMP chromosomal position in relation to the HOXD10 gene is also depicted. This gene is of interest because it has been found to be differentially methylated in ancient and modern hominin species (Gokhman et al., 2014). Of the sites depicted here, 5 DMPs were found to show significant species–specific methylation in marmosets. Of the five species–specific DMPs in the HOXD10 gene of marmosets, four have Δβ between 0.2 and 0.3 (**) and one has a Δβ < 0.1 (*). See Table S13 for additional information. In the HOXD10 gene, the two exons are denoted with the thickest bars (exon 1: hg19 chr2:176,981,561–176,982,306; exon 2: hg19 chr2:176,983,681–176,983,959), the UTRs are denoted with bars of intermediate thickness (5’UTR: hg19 chr2:176,981,491–176,981,561; 3’UTR: hg19 chr2:176,983,959–176,984,670), and the one intron is denoted with the thinnest bar (intron 1: hg19 chr2:176,982,306–17,698,368)
