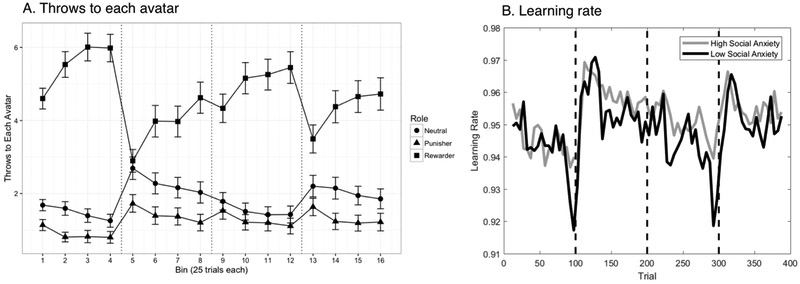
Figure 1.
Learning rate and throwing behavior over the Volatile Social Learning Task. Dotted vertical lines represent role shifts between blocks. A) Throws to each avatar role were grouped into 25-trial bins and averaged across all participants. Error bars represent the 95% confidence interval. B) Learning rate was estimated over 25-trial windows with a 5-trial overlap. Although analyses reported were performed on social anxiety as a continuous variable, social anxiety is split into extreme groups for this figure: participants with SIAS scores less than or equal to three quarters of a standard deviation (10 or under) below the mean of a previous community sample (M= 18.8, SD=11.8; Mattick & Clarke, 1998) were included in the low social anxiety group, and those scoring greater than or equal to three quarters of a standard deviation (28 or greater) above the mean were included in the high social anxiety group.

