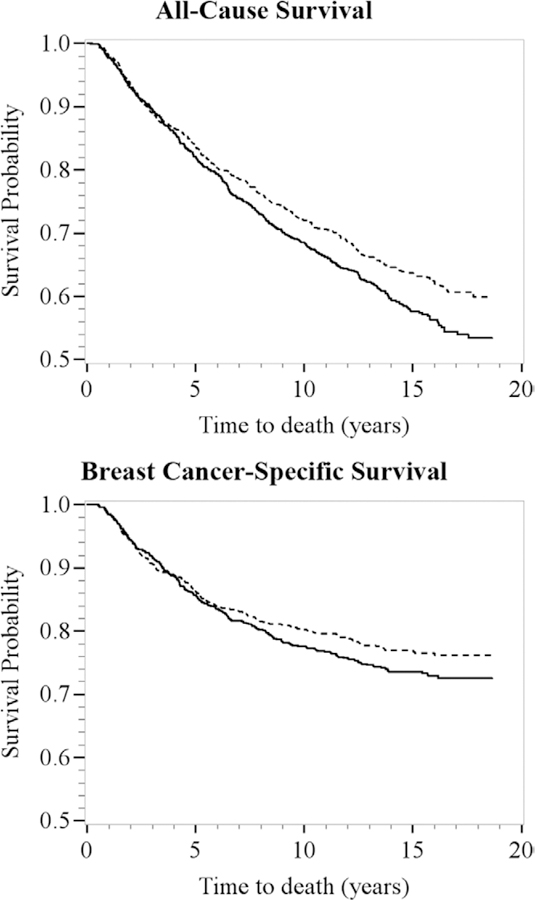
FIGURE 2.
Kaplan-Meier survival curves for latent class assignment: healthy behavior and diet, dashed line (n = 916, 51%) versus healthy behavior and unhealthy diet (n = 624, 34%) and unhealthy behavior and diet (n = 268, 15%), solid line, for all-cause (top) and breast cancer–specific (bottom) survival. Carolina Breast Cancer Study participants were diagnosed with invasive breast cancer from 1993 to 1996 (Phase I) and 1996 to 2000 (Phase II) and followed-up for vital status through December 31, 2011 (n = 1,808). The x axes show time to death in years; the y axes show proportion of participants alive.

