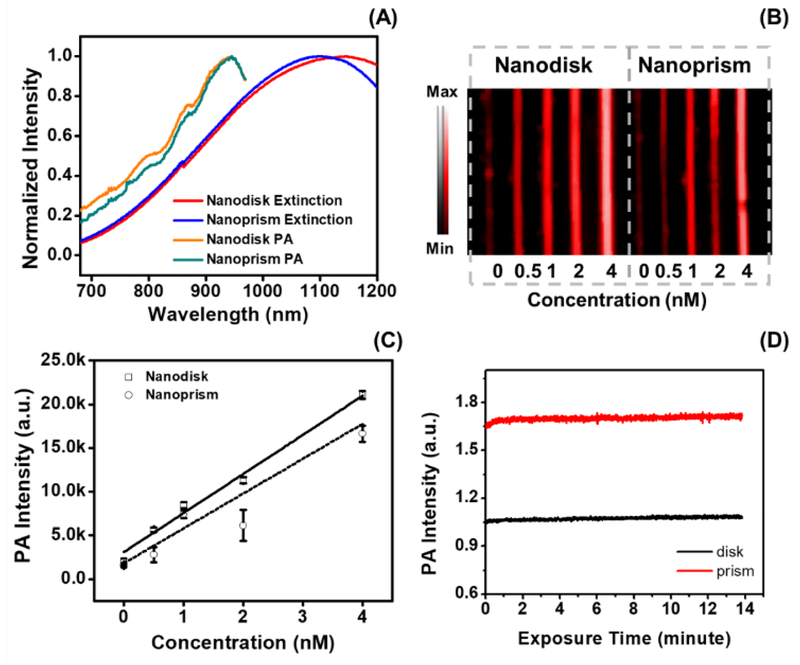
Figure 2: Photoacoustic signal capabilities of CuS nanodisks and nanoprisms.
Panel A compares the extinction spectra with the photoacoustic spectra of CuS nanodisks and nanoprisms. The extinction peak of nanodisks and nanoprisms was 1145 and 1098 nm, respectively, and both CuS nanoparticles had maximum photoacoustic output at 945 nm. The derivation of peak intensity between photoacoustic and extinction spectrum is due to the limited range of our laser (680 to 970 nm) and the lower laser energy at further infrared wavelengths (Fig. S4). The photoacoustic intensity measured at 945 nm of the two CuS nanoparticles is shown in B. The corresponding intensity analysis shown in C revealed the linear correlation between the photoacoustic intensity and the concentration of the nanodisks (solid line, R2>0.97) and nanoprism (dashed line, R2>0.91). Panel D highlights the stability of CuS nanodisk (RSD=0.84%) and nanoprism (RSD=0.73%) over a 14-minute laser irradiation at 940 nm. Error bars in panel C and D represents standard deviation of 8 regions of interest.

