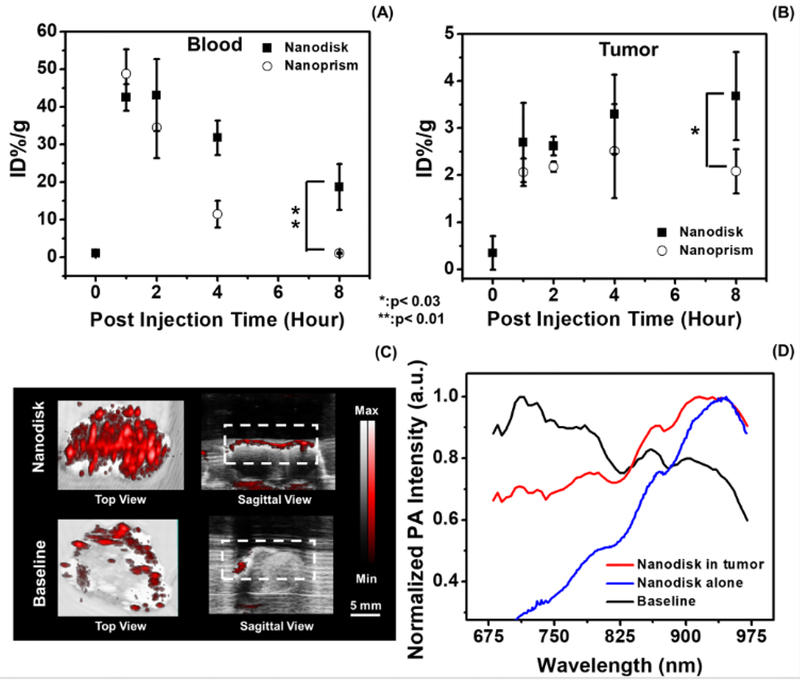
Figure 3: Shape-dependent accumulation of nanoparticles in tumor and photoacoustic ovarian tumor imaging.
Panel A and B shows the Cu ion concentration of the blood and tumor samples collected from mice treated with CuS nanodisks and nanoprisms, respectively. Eight hours after the treatment, the mice treated with nanodisk had 17.9-fold and 1.8-fold higher Cu concentration in the blood and tumor than the mice treated with nanoprisms. Here the data points at baseline represent the tumor without any nanoparticle treatment. The error bars in panel A and B denote the standard deviation from 4 mice. Panel C showed the photoacoustic images at 920 nm excitation of the tumor samples from the mice treated with CuS nanodisk (Nanodisk) and the mice without treatment (Baseline). The white dash line labels the regions of interest for the photoacoustic spectral analysis (D). The photoacoustic spectral profile of the tumor treated with the nanodisk agrees well with the nanodisk particles alone. The animals treated with CuS nanodisks revealed a maximum photoacoustic signal at 920 nm while the untreated tumors showed a maximum intensity at 713 nm.

