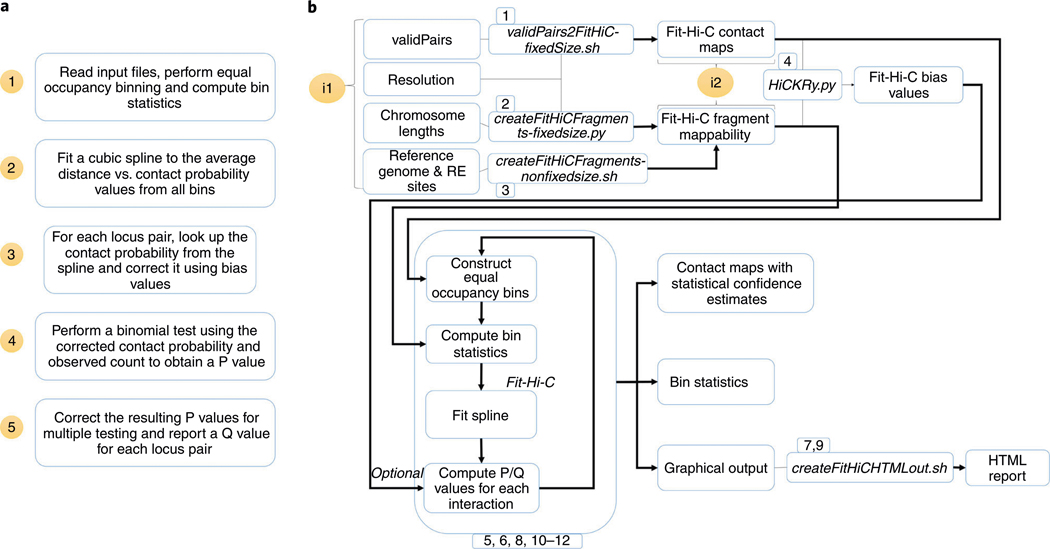
Fig. 1 |. FitHiC2 flowchart.
a, A brief overview of the main stages of analysis performed by FitHiC2. b, A more complete overview of all scripts and utilities incorporated into the FitHiC2 repository. FitHiC2 provides multiple different entry points to the workflow (denoted by i1 and i2), thereby allowing several file formats to be converted to expected input files, namely, contact counts, fragments and bias values files. For b, the numbers listed in boxes represent the corresponding steps in the Procedure section.

