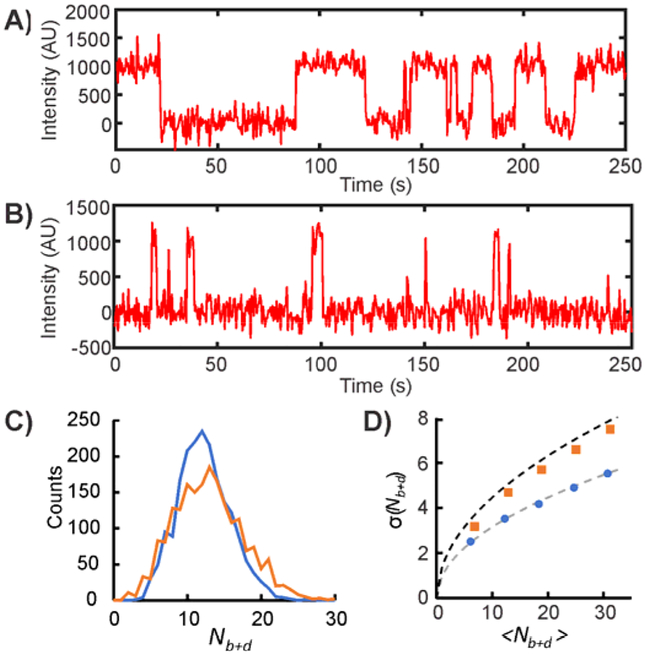
Fig. 8.
Impact of relative bound and unbound state lifetimes on the distribution of Nb+d. (A,B) Simulated intensity versus time traces for probes with equal (τbound = τunbound = 20 s) and very different (τbound = 2 s, τunbound = 38 s) lifetimes in the bound and unbound states. (C) Nb+d distributions for 2,000 simulated intensity versus time traces with τbound = τunbound = 20 s (blue curve) or τbound = 2 s, τunbound = 38 s (orange curve). The distribution becomes broader if τbound ≠ τunbound due to strong temporal correlation between binding and dissociation events. (D) Standard deviation in the Nb+d values of 2,000 simulated intensity versus time traces as a function of average Nb+d value, which increases with increasing observation time. When τbound = τunbound (blue circles), σ(Nb+d) increases as (gray dashed line), consistent with expectations for a Poisson process. However, when τbound ≠ τunbound (orange squares), σ(Nb+d) increases more rapidly due to temporal correlation of binding and dissociation events. In the limit where either τbound or τunbound is infinitesimal, σ(Nb+d) increases as (black dashed line) – consistent with Nb+d/2 being Poisson-distributed.

