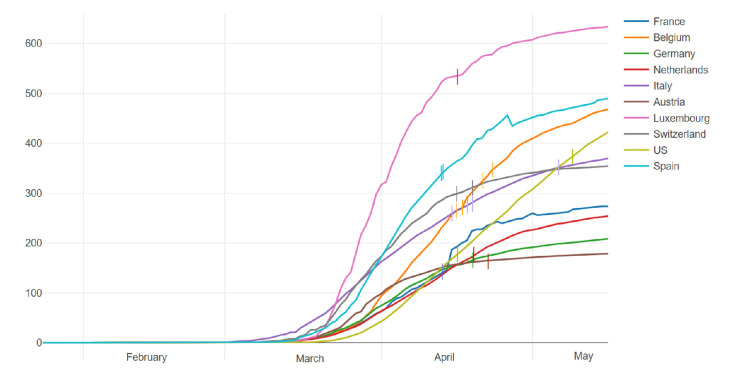
Figure 1.
COVID-19 infection per 100 000 inhabitants. The curves represent the number of patients per 100 000 inhabitants with positive results for COVID-19 over time in the 10 countries included in the survey from 22 January to 13 May 2020. Each bar on the curves corresponds to one investigator. On the x-axis, the timing from February to May is shown; on the y-axis, the N of patients per 100 000 inhabitants is shown.

