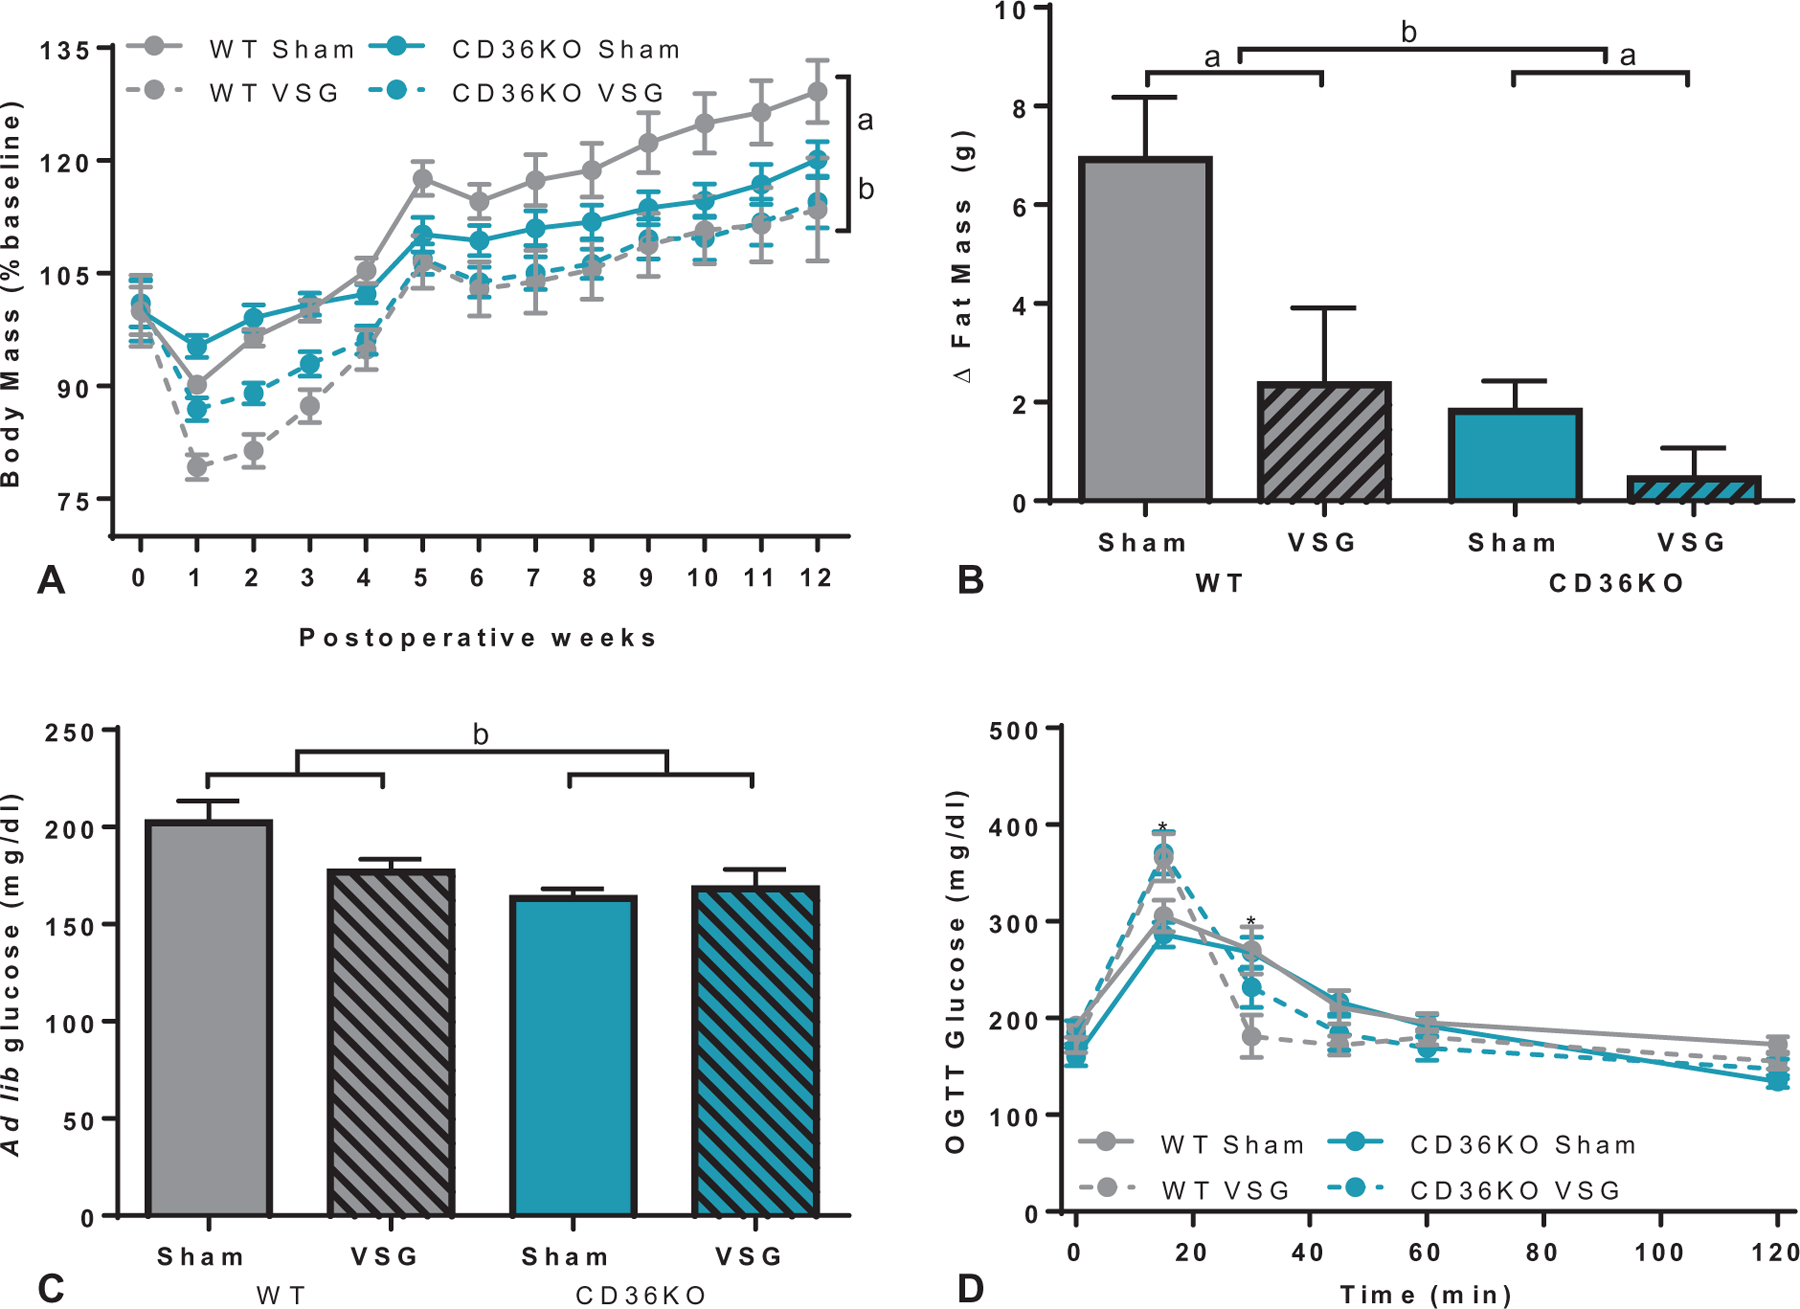
FIGURE 6.

Body mass and glucose regulation after VSG in CD36KO mice. A, VSG decreased body mass (% baseline) in both WT and CD36KO up to 12 weeks postoperatively (aP < 0.01, time × surgery interaction), and CD36KO mice had overall lower body mass compared with WT mice (bP < 0.0001, time × genotype interaction). B, The change in fat mass between preoperative levels and 8 weeks after surgery revealed both WT and CD36KO lost fat-specific mass compared with respective sham controls (aP < 0.01, main effect of surgery) and that CD36KO mice had lower fat mass compared with WT mice (bP < 0.01, main effect of genotype). C, CD36KO mice had decreased ad lib fed glucose levels 2 weeks after surgery compared with WT mice (bP < 0.05, main effect of genotype). D, VSG increased the glucose response 15 minutes after an oral glucose load (2 g/kg) compared with sham-operated mice (*P < 0.001, time×surgery interaction), and improved glucose tolerance at the 30-minute time point (*P < 0.01, time×surgery interaction).
