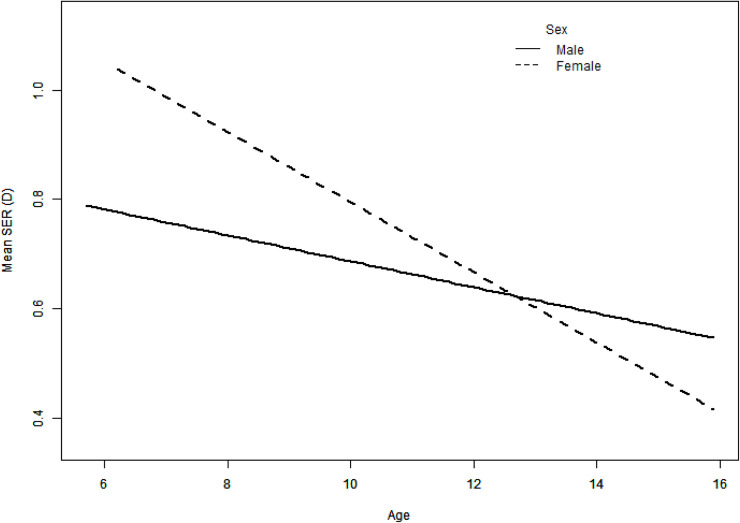
Fig 1. Smooth curve fitting between mean spherical equivalent refraction (SER) and age.
Mean SER decreased with age both in males (solid lines, β = -0.02, 95% CI: -0.05~0, P = 0.04) and females (dashed lines, β = -0.06, 95% CI: -0.09~ -0.04, P < 0.0001). There was a faster mean SER reduction in females compared to males (P = 0.02, interaction test).

