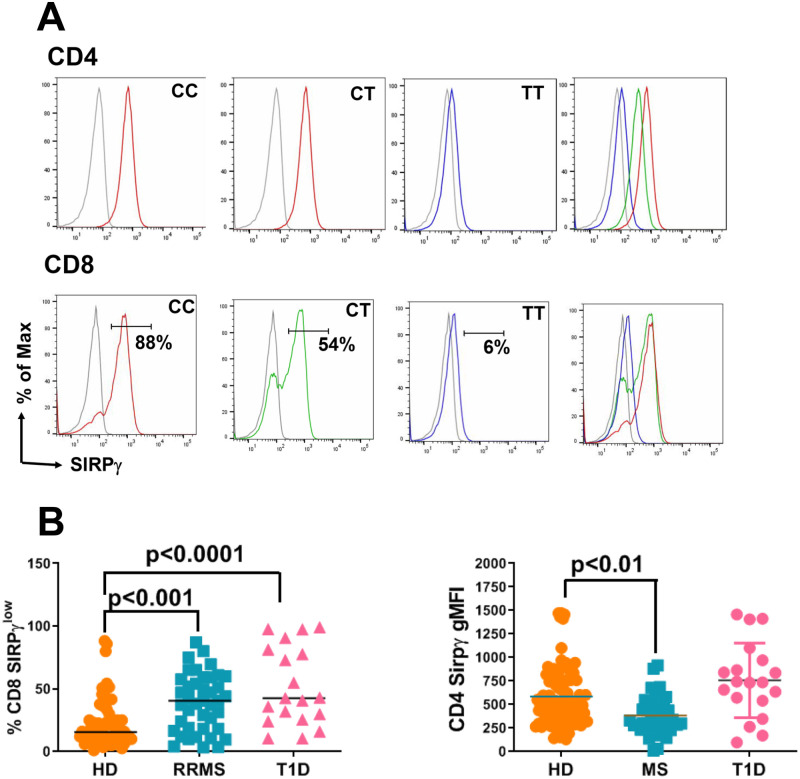
Fig 2. T-cells from RRMS and T1D patients have significantly reduced SIRPγ expression as compared to HD.
Representative histograms for SIRPγ staining in RRMS patients is shown in A. Since SIRPγ shows a bimodal distribution on CD8 T-cells, SIRPγlow vs. SIRPγhigh gates are shown for CD8 T-cells. Isotype control is shown in grey. PBMC samples from HD, RRMS and T1D patients were subjected to flow cytometry staining to detect SIRPγ on gated CD3, CD4 and CD8 T-cells as described previously [8]. SIRPγ gMFI data for CD4 T-cells and frequency of SIRPγlow CD8 T-cells are shown in B. One-way ANOVA with Tukey’s multiple comparison was performed and p<0.05 was considered significant.

