

Abstract
Gibberellic acid from the fungi has been widely used in agriculture. In this study, more than 20 fungal isolates were screened and Paecilomyces sp. ZB shown to produce more gibberellic acid than other fungal isolates. Cow dung was used as low cost substrate for gibberellic acid production in solid state fermentation (SSF). Carbon, nitrogen and ionic sources stimulated gibberellic acid production in SSF. Lactose emerged as the significant carbon source supporting more gibberellic acid production (731 µg/g). Among the nitrogen sources, glycine appeared to influence the production of more gibberellic acid (803 µg/g). The process parameters were optimized to enhance gibberellic acid production using a two-level full factorial design and response surface methodology. The amount of gibberellic acid production was influenced mainly by moisture and pH of the substrate. Gibberellic acid production was 1312 µg/g under the optimized conditions and the predicted response was 1339 µg/g. The gibberellic acid yield increased twofolds after medium optimization. The extracted gibberellic acid was sprayed on the growing Mung bean plant and it stimulated the growth of the plant effectively. To conclude, cow dung is a new alternative to produce gibberellic acid in SSF.
Keywords: Gibberellic acid, Response surface methodology, Solid-state fermentation, Plant growth promoter
1. Introduction
Gibberellic acid is a member of the group of plant growth hormones known as gibberellins. Gibberellic acid is a diterpenoid acid that influences plant growth through stem elongation, germination, breaking dormancy, inducing flowering, sex expression, induction of hydrolytic enzymes, and leaf and fruit senescence (Rodrigues et al., 2012). Hence, gibberellic acid is commercially used to increase the yield in agricultural practices. It is also used in plant tissue culture in low concentrations. There is a huge demand for gibberellic acid in the world market. Due to the price concern, it is used only to improve the yield of selected crops. The substrate such as citric pulp has been used as the cheap biomass for gibberellic acid production (de Oliveira et al., 2017). The fungi Fusarium moniliforme is the most used organism for the production of gibberellic acid through submerged fermentation. The yield of gibberellic acid in submerged fermentation is low. Solid-state fermentation (SSF) technology is emerging as an alternative to submerged fermentation in suitable applications. It uses solid substrate with a moisture content of 12–80%. There is no free water since the water retention capacity of the solid substrate retains the moisture within and the final product concentrated (Robinson et al., 2001). Recent reports indicate that gibberellic acid production is much more enhanced in SSF compared with submerged fermentation (Chen, 2013). The possible usage of solid waste materials from agricultural fields and the industries that process agricultural produce makes SSF more attractive. In addition, it is not seasonal and is available throughout the year. Many commercially important products have been produced by SSF using cow dung (Vijayaraghavan et al., 2016). Recently, gibberellic acid production has been optimized for Fusarium oxysporum using various optimization strategies and the potency was evaluated under stress condition (Ben Rhouma et al., 2020). The application of gibberellic acid and advances were recently reported by de Camara et al. (2018).
Factorial design can minimize the number of runs required to find out the significant factors influencing the process and, at the same time, gives information regarding the interaction between the factors (Czitrom, 1999). Furthermore, the runs can be randomized to block the variations within the same levels of a variable (Shivhare and McCreath, 2010). A statistical model in the form of a quadratic equation can be produced using the central composite design (CCD) of response surface methodology (RSM). The vital factors determined using factorial design along with any factors that are generally regarded significant for the process can be included in the CCD process. This method reduces the number of runs required compared with factorial design. After building the statistical model, the same can be used to construct response surface plots and find out the optimal levels of factors to be used in the process (Baş and Boyacı, 2007). The advantage of chief gibberellic acid producing fungus, Fusarium fujikuroi and advances were analyzed by Cen et al. (2020). Thin-layer chromatography (TLC) is a cheap and easier technique to compare the gibberellic acid produced through SSF. It can also be used to separate and identify gibberellic acid among the different members of the gibberellin family (Tsavkelova, 2016) and among other plant growth hormones (Karadeniz et al., 2006).
The fungi such as, Fusarium fujikuroi, Fusarium moniliforme, Fusarium proliferatum, and mutant strain of Fusarium fujikuroi produced GA3 in submerged and solid state fermentation (Camara et al., 2018). In this paper, cow dung was used as the substrate for SSF for gibberellic acid production using the fungus Paecilomyces sp. ZB, which was isolated from the root tip of plantain. The important process parameters of SSF were optimized using RSM. Gibberellic acid was sprayed on Mung bean plant and the efficacy of gibberellic acid on the growth performance was studied.
2. Materials and methods
2.1. Isolation of organisms producing gibberellic acid
The fungus producing gibberellic acid was isolated from a plantain field near Nagercoil, Tamilnadu, India. Samples were collected by swabbing the root tip of banana plants using sterile cotton swabs. The swabs were plated on potato dextrose agar plates of the following composition: [g/l], potatoes 300 g, glucose 20 g, and agar 15 g. Each colony was picked and inoculated into separate nutrient broth liquid media in 250-mL Erlenmeyer flasks.
2.2. Identification of gibberellic acid producing fungal strain
The organism that produced the maximum amount of gibberellic acid among the five isolates was subjected to biochemical characterizations. The fungus was further identified using 18S rRNA sequencing (Rejiniemon et al., 2015). The organism was identified as Paecilomyces sp. ZB. The sequence was submitted to GenBank using the BankIt tool.
2.3. Solid-State fermentation and gibberellic acid assay
SSF was carried out in an Erlenmeyer flask of 250 mL by taking 5 g of the substrate and maintaining 70% of moisture using sodium phosphate buffer (pH 6.0, 0.1 M). Five organisms were selected and SSF was carried out individually. The medium components were mixed thoroughly and autoclaved at 121 °C for 15 min. Once the flask reached the room temperature, the medium was inoculated with 0.5 mL of 7-day-old mother culture broth individually under sterile conditions. The flasks were then incubated at 37 °C for 8 days. Then 50-mL sodium phosphate buffer (pH 7.4, 0.1 M) was added to the fermentation medium and mixed well. The slurry was filtered and the filtrate was centrifuged (10,000 rpm, 20 min).
2.4. Quantification of gibberellic acid
50 mL culture extract was filtered using Whatman no 42 filter paper and the pH of the filterate was adjusted at the range of 2.5 – 3.0 using 0.1% HCl. This acidified sample was extracted thrice with ethyl acetate (medium and solvent at 1:3 ratio). The solvent portion of all three stages was collected, dried and residue was suspended in acetonitrile. The residue was used for HPLC analysis. The standard gibberellin (1 mg) GA3 was dissolved in acetonitrile and the final working concentration was adjusted as 1 μg/mL. Standard (10 µL) was injected in HPLC and detected at 206 nm.
2.5. Determination of GA3 using Thin layer chromatography (TLC)
A ready-to-use TLC plate was used for analysis (Merck, Bangalore, India). The TLC plate (10 × 20 cm) was cut appropriately. The sample and standard GA3 was dissolved in acetonitrile and spotted on TLC plates and the solvent was evaporated. Then, the plate was developed inside a TLC chamber using the solvent system [benzene: nbutanol: acetic acid (6:3:3)]. The developed spots were sprayed with ethanol:conc. sulfuric acid (95:5) and visualized using UV illuminator at 254 nm.
2.6. Initial screening of significant process variables using one-factor-at-a-time (OFAT) approach
SSF was carried out in separate 100-mL Erlenmeyer flasks with 5 g of cow dung substrate. The fermentation process variables such as carbon source (1%) (lactose, sucrose, maltose, glucose, and starch), nitrogen sources (0.5%) (ammonium sulphate, casein, oat meal, glycine, and skim milk), and inorganic salts (0.1%) (calcium, magnesium, manganese, copper, and zinc) were evaluated one at a time, keeping other variables constant. After the completion of fermentation, 50 mL of sodium phosphate buffer (pH 6, 0.1 M) was used to extract the gibberellic acid produced. The experiments were done in triplicate, and the values were averaged.
2.7. Identification of significant process variables using two-level full factorial design
The statistical software Design-Expert 9.0 (StatEase Inc, Minneapolis, MN, USA) was employed to design a full factorial design with two levels of process parameter values. The most significant process variables that influence the production of gibberellic acid were probed by carrying out the experiments according to the design, at two levels (+and -) for the aforementioned five factors and at mid level for other factors. The response Y of the two-level full factorial design is governed by the following first-order polynomial equation:
| (1) |
where α0 is the intercept, αi is the ith linear coefficient, and αij and αijk are the ijth and ijkth interaction coefficients. The results of the factorial design experiment were fitted in (1). The vitality of the variables or interactions to the process was inferred from the values of coefficients in the resulting polynomial equation. It was further confirmed by performing analysis of variance (ANOVA).
2.8. Building quadratic model using central composite design and finding optimal levels of significant variables using RSM
CCD was used to build a quadratic equation that models the response of most significant factors. Moisture (A), pH (B), and calcium (C) were the factors taken for CCD. These factors were studied at five levels coded as −α, −1, 0, 1, and +α. The level coded as “0″ was the centre point, “−1” and “1” were the factorial points, and −α and +α were the axial points. The design had 20 experiments involving 8 factorial, 6 axial, and 6 centre points. The experiments were done as triplicates, and the mean value of gibberellic acid amounts is taken as the response Y. The data were fitted in the following quadratic equation for three factors:
| (2) |
where Y is the response, β0 is the offset term, βi is the coefficient of linear term, βii is the coefficient of square terms, and βij is the coefficient of interactive terms. A, B, and C are represented as Xi’s. AB, AC, and BC are represented as Xij’s. The coefficient of the terms reflected their importance in the design.
2.9. Statistical model validation
The optimal levels for the variables for maximum production of gibberellic acid were obtained from RSM. These values were followed in a process, and the response was recorded and compared with the predicted response to validate the model.
2.10. Growth promoting activity of GA on the plant Vigna radiata
In the present study, Vigna radiata plant was selected to study the effect of gibberellic acid on the growth. The plant was sprayed with gibberellic acid at the concentration of 50–250 ppm. Double distilled water spray was considered as control. Spraying of plant growth regulators were performed after 15 days of sowing. Manure, water and plant protection measures were taken regularly.
3. Results
3.1. Isolation and screening of gibberellic acid producing the fungus Paecilomyces sp.ZB
Five morphologically different fungal isolates were obtained from banana root tip through the isolation procedure described in materials and methods. Gibberellic acid production was found to be maximum in Paecilomyces sp. ZB (512 µg/g) among the screened fungal isolates. Through DNA sequencing, the fungus was identified as Paecilomyces sp. ZB. The 1630-bp rRNA sequence was submitted to GenBank and accession number was assigned (KX134678).
3.2. Determination of GA3 using High performance liquid chromatography and Thin layer chromatography
In this study, 0.01% o-phosphoric acid was used for the elution of GA3 because of the nature of double bond isomer. The elution profile of GA3 using C18 column was achieved at 206 nm (Fig. 1a) with the flow rate of 0. 6 mL per min. The culture supernatant was applied as spots on the TLC plate, and GA3 was visualized under UV light for confirmation. GA3 was appeared as a dark band (Fig. 1b). Before optimization, the yield ranged between 251 and 540 µg/g among the fungal strains and the Fig. 1a showed variation in GA3 yield.
Fig. 1.

(a) High Performance Liquid Chromatography separation of gibberellic acid from Paecilomyces sp. (b) TLC of gibberellic acid from the five isolated organisms. The medium extract of 20 µL from each of the individual organisms (lanes a–e) were loaded individually. The bands were developed in the solvent system (isopropanol, ammonia, and water, 10:1:1) and the visualized under UV light. Arrow: band corresponding to gibberellic acid. The intense band in lane e indicates the maximum amount of gibberellic acid.
3.3. Traditional OFAT approach revealed lactose, glycine, and calcium as significant carbon, nitrogen, and inorganic ion influencing SSF process
In the present study Paecilomyces sp. ZB used cow dung substrate effectively for its growth and gibberellic acid production. The simple “OFAT” approach was used to evaluate the important nutrient sources concerning the SSF using Paecilomyces sp. ZB. The crucial physical parameters such as moisture (70%), inoculums size (10%), and fermentation period (7 days) were kept at optimal levels during these experimental runs. Glucose, maltose, sucrose, fructose, trehalose, dextrose, and lactose were selected as the candidate carbon sources. Lactose emerged as the significant carbon source supporting more gibberellic acid production (731 µg/g) (Fig. 2A). Among the nitrogen sources, glycine appeared to influence the production of more gibberellic acid (803 µg/g) (Fig. 2B). Calcium in the SSF medium aided the increased production of gibberellic acid (763 µg/g) (Fig. 2C) compared with other ions.
Fig. 2.

Effect of various carbon, nitrogen, and inorganic ion sources on gibberellic acid production. The amount of gibberellic acid (µg/g substrate) produced are plotted against the nutrient sources: (a) carbon source, (b) nitrogen source, and (c) inorganic ions. Horizontal bars: standard deviation.
3.4. Two-level five-factor design revealed moisture, pH, and calcium as the most significant factors
The five parameters chosen for two-level full factorial design were A—moisture, B—pH, C—lactose, D—glycine, and E—calcium. The actual levels corresponding to the coded levels were shown in Table 1. The randomized experimental runs and the coded levels of different combinations of the five parameters along with the resultant amount of gibberellic acid produced were shown in Table 2a. The amount of gibberellic acid produced ranged from 1016 to 1470 µg/g cow dung. The results of ANOVA were shown in Table 2b. The model had an F ratio value of 73.74 leaving only less than 0.01% chance for occurrence due to noise. The model terms A, B, E, AC, AD, AE, BC, BD, BE, CD, CE, DE, ABD, ACE, BCD, BCE, ABCD, ACDE, BCDE, and ABCDE were statistically significant. The R2 value of the model value was 0.9949. The predicted R2 value was 0.9302, and the adjusted R2 value was 0.9810. The model had an adequate precision of 35.216, which was way higher than the required value of 4. This makes clear that the signal is adequate, and the model can be used to navigate the design space to predict the relative impact of process parameters. The model equation with significant terms can be written as:
Table 1.
The independent variables chosen for 25 factorial design and their coded levels.
| Symbol | Variables | Units | Coded levels |
|
|---|---|---|---|---|
| −1 | +1 | |||
| A | Moisture | % | 60 | 90 |
| B | pH | 5 | 7 | |
| C | Lactose | % | 0.1 | 1 |
| D | Glycine | % | 0.1 | 0.5 |
| E | Calcium | % | 0.05 | 0.5 |
Table 2a.
Randomized runs of 25 factorial design and gibberllic acid production.
| Run | A:Moisture % |
B:pH | C:Lactose % |
D:Glycine % |
E:Calcium % |
GAA (µg/g) |
|---|---|---|---|---|---|---|
| 1 | 1 | 1 | 1 | 1 | 1 | 1163 |
| 2 | −1 | −1 | −1 | 1 | −1 | 1033 |
| 3 | 1 | 1 | −1 | −1 | 1 | 1442 |
| 4 | −1 | 1 | −1 | 1 | −1 | 1288 |
| 5 | −1 | 1 | −1 | 1 | 1 | 1264 |
| 6 | 1 | −1 | −1 | −1 | −1 | 1021 |
| 7 | 1 | 1 | −1 | 1 | 1 | 1303 |
| 8 | −1 | 1 | −1 | −1 | −1 | 1241 |
| 9 | 1 | 1 | 1 | −1 | 1 | 1246 |
| 10 | 1 | −1 | 1 | 1 | −1 | 1292 |
| 11 | 1 | −1 | 1 | −1 | 1 | 1043 |
| 12 | −1 | −1 | 1 | 1 | 1 | 1209 |
| 13 | 1 | 1 | −1 | −1 | −1 | 1365 |
| 14 | −1 | 1 | 1 | 1 | 1 | 1204 |
| 15 | −1 | 1 | 1 | −1 | −1 | 1332 |
| 16 | 1 | 1 | 1 | 1 | −1 | 1470 |
| 17 | −1 | 1 | −1 | −1 | 1 | 1290 |
| 18 | −1 | −1 | −1 | −1 | 1 | 1200 |
| 19 | 1 | −1 | −1 | 1 | −1 | 1290 |
| 20 | 1 | −1 | −1 | 1 | 1 | 1164 |
| 21 | −1 | −1 | 1 | −1 | 1 | 1235 |
| 22 | 1 | −1 | 1 | −1 | −1 | 1233 |
| 23 | 1 | −1 | 1 | 1 | 1 | 1228 |
| 24 | 1 | 1 | 1 | −1 | −1 | 1332 |
| 25 | −1 | 1 | 1 | 1 | −1 | 1275 |
| 26 | −1 | 1 | 1 | −1 | 1 | 1316 |
| 27 | 1 | −1 | −1 | −1 | 1 | 1254 |
| 28 | 1 | 1 | −1 | 1 | −1 | 1283 |
| 29 | −1 | −1 | 1 | −1 | −1 | 1016 |
| 30 | −1 | −1 | 1 | 1 | −1 | 1245 |
| 31 | −1 | −1 | −1 | 1 | 1 | 1110 |
| 32 | −1 | −1 | −1 | −1 | −1 | 1200 |
Table 2b.
ANOVA results for 25 factorial design for screening of selected variables.
| Source | Sum of squares | df | Mean square | F-Value | p-Value |
|---|---|---|---|---|---|
| Model | 3.617E + 005 | 22 | 16441.63 | 73.74 | < 0.0001 |
| A-Moisture | 14070.03 | 1 | 14070.03 | 63.10 | < 0.0001 |
| B-pH | 1.302E + 005 | 1 | 1.302E + 005 | 583.82 | < 0.0001 |
| E-Calcium | 1875.00 | 1 | 1875.00 | 8.41 | 0.0176 |
| AC | 3220.50 | 1 | 3220.50 | 14.44 | 0.0042 |
| AD | 6583.13 | 1 | 6583.13 | 29.53 | 0.0004 |
| AE | 12840.13 | 1 | 12840.13 | 57.58 | < 0.0001 |
| BC | 4209.13 | 1 | 4209.13 | 18.88 | 0.0019 |
| BD | 14577.78 | 1 | 14577.78 | 65.38 | <0.0001 |
| BE | 6932.53 | 1 | 6932.53 | 31.09 | 0.0003 |
| CD | 11666.13 | 1 | 11666.13 | 52.32 | < 0.0001 |
| CE | 22951.13 | 1 | 22951.13 | 102.93 | < 0.0001 |
| DE | 20859.50 | 1 | 20859.50 | 93.55 | < 0.0001 |
| ABD | 7657.13 | 1 | 7657.13 | 34.34 | 0.0002 |
| ABE | 935.13 | 1 | 935.13 | 4.19 | 0.0708 |
| ACE | 22313.50 | 1 | 22313.50 | 100.07 | < 0.0001 |
| ADE | 1313.13 | 1 | 1313.13 | 5.89 | 0.0382 |
| BCD | 6022.13 | 1 | 6022.13 | 27.01 | 0.0006 |
| BCE | 3762.13 | 1 | 3762.13 | 16.88 | 0.0026 |
| ABCD | 23166.28 | 1 | 23166.28 | 103.90 | < 0.0001 |
| ACDE | 12600.78 | 1 | 12600.78 | 56.51 | < 0.0001 |
| BCDE | 2793.78 | 1 | 2793.78 | 12.53 | 0.0063 |
| ABCDE | 31187.53 | 1 | 31187.53 | 139.87 | < 0.0001 |
| Residual | 2006.78 | 9 | 222.98 | ||
| Cor Total | 3.637E + 005 | 31 |
Gibberellic acid (µg/g) = +1237.09 + 20.97A + 63.78B – 7.66E – 10.03AC + 14.34AD – 20.03AE – 11.47BC – 21.34BD – 14.72BE + 19.09CD – 26.78CE – 25.53DE – 15.47ABD + 5.41ABE – 26.41ACE – 6.41ADE – 13.72BCD – 10.84BCE + 26.91ABCD + 19.84ACDE – 9.34 – 31.22ABCDE
The negative coefficient of − 7.66 for the parameter E (calcium) indicated that the amount of gibberellic acid produced could be increased by decreasing the amount of calcium in the medium. Based on the results of two-level full factorial design, moisture, pH, and calcium were considered for CCD and RSM.
3.5. CCD and RSM
The three vital process parameters moisture (A), pH (B) and calcium (C) were taken at five coded levels (−α, −1, 0, +1, and + α), as shown in Table 3. ANOVA was performed on the results of CCD, and the following quadratic equation was obtained:
Table 3.
The independent variables selected for CCD and their coded values.
| Variables | Symbol | Coded values |
||||
|---|---|---|---|---|---|---|
| -α | −1 | 0 | +1 | + α | ||
| Moisture | A | 49.7731 | 60 | 75 | 90 | 100.227 |
| pH | B | 4.31821 | 5 | 6 | 7 | 7.68179 |
| Calcium | C | −0.206807 | 0.1 | 0.55 | 1 | 1.30681 |
Gibberellic acid (µg/g) = +1335.98 + 23.08A + 22.20B − 2.91C – 14.75AB + 33.25AC – 13.50BC 39.51A2 – 42.16B2 − 32.61C2.
Gibberellic acid production observed was maximum (1360 µg/g) at run 16 (Table 4a). The model F-value was 30.79, and this implied that the model was statistically significant (Table 4b). There was only 0.01% chance that this much large F-value could occur due to noise. The model terms A, B, AB, AC, BC, A2, B2, and C2 were concluded as significant as their “Prob > F” value is <0.05. In addition, the model does not have a significant lack of fit F-value (0.29) relative to the pure error. In this model, the predicted R-squared value (0.9003) is in good agreement with the adjusted R-squared value (0.9338). The optimal level of moisture is 79%, pH is 6.2, and calcium is 0.01%. The three-dimensional response surface graph depicts the interaction between the variables and maintains the third variable at its zero level. As shown in Fig. 3, the interactions between pH and moisture content variable were found to be significant. Gibberellic acid production of the SSF varied significantly upon the changes in pH and moisture.
Table 4a.
CCD experimental runs for optimizing gibberellic acid production.
| Run | A:Moisture | B:pH | C:Calcium | GAA (µg/g) |
|---|---|---|---|---|
| 1 | 0.000 | 0.000 | 0.000 | 1348 |
| 2 | 1.682 | 0.000 | 0.000 | 1260 |
| 3 | −1.000 | 1.000 | −1.000 | 1291 |
| 4 | 1.000 | −1.000 | 1.000 | 1280 |
| 5 | −1.000 | −1.000 | −1.000 | 1187 |
| 6 | 0.000 | 0.000 | 1.682 | 1240 |
| 7 | 1.000 | 1.000 | −1.000 | 1247 |
| 8 | 0.000 | 1.682 | 0.000 | 1240 |
| 9 | 0.000 | 0.000 | 0.000 | 1340 |
| 10 | −1.000 | −1.000 | 1.000 | 1132 |
| 11 | 1.000 | 1.000 | 1.000 | 1271 |
| 12 | 0.000 | 0.000 | 0.000 | 1321 |
| 13 | 0.000 | 0.000 | 0.000 | 1302 |
| 14 | 0.000 | −1.682 | 0.000 | 1187 |
| 15 | 0.000 | 0.000 | −1.682 | 1241 |
| 16 | 0.000 | 0.000 | 0.000 | 1360 |
| 17 | 1.000 | −1.000 | −1.000 | 1190 |
| 18 | −1.682 | 0.000 | 0.000 | 1182 |
| 19 | −1.000 | 1.000 | 1.000 | 1194 |
| 20 | 0.000 | 0.000 | 0.000 | 1346 |
Table 4b.
ANOVA for CCD design results.
| Source | Sum of squares | df | Mean square | F-Value | p-Value |
|---|---|---|---|---|---|
| Model | 79274.50 | 9 | 8808.28 | 30.79 | <0.0001 |
| A-Moisture | 7273.88 | 1 | 7273.88 | 25.43 | 0.0005 |
| B-pH | 6728.55 | 1 | 6728.55 | 23.52 | 0.0007 |
| C-Calcium | 115.30 | 1 | 115.30 | 0.40 | 0.5398 |
| AB | 1740.50 | 1 | 1740.50 | 6.08 | 0.0333 |
| AC | 8844.50 | 1 | 8844.50 | 30.92 | 0.0002 |
| BC | 1458.00 | 1 | 1458.00 | 5.10 | 0.0476 |
| A2 | 22491.56 | 1 | 22491.56 | 78.63 | <0.0001 |
| B2 | 25612.20 | 1 | 25612.20 | 89.54 | <0.0001 |
| C2 | 15326.34 | 1 | 15326.34 | 53.58 | <0.0001 |
| Residual | 2860.45 | 10 | 286.05 | ||
| Lack of fit | 643.62 | 5 | 128.72 | 0.29 | 0.8996 |
| Pure error | 2216.83 | 5 | 443.37 | ||
| Cor total | 82134.95 | 19 |
Fig. 3.

Three-dimensional response surface plots. (a) Response surface showing the interactive effect of pH and moisture on gibberellic acid production in SSF using cow dung employing Paecilomyces sp. ZB. (b) Response surface showing the interactive effect of calcium and moisture on gibberellic acid production in SSF using cow dung employing Paecilomyces sp. ZB. (c) Response surface showing the interactive effect of calcium and pH on gibberellic acid production in SSF using cow dung employing Paecilomyces sp. ZB.
3.6. Validation of the statistical model
The predictive model obtained through CCD was validated by carrying out the fermentation process in triplicates. Cow dung substrate along with the optimized levels of process parameters was used in the process, and the amount of gibberellic acid produced was estimated. The amount of gibberellic acid produced was 1312 µg/g, which was in agreement with the predicted amount of 1339 µg/g. Thus, there was a two-fold increase in the production of gibberellic acid by Paecilomyces sp. ZB using cow dung substrate.
3.7. GA induced growth on the plant Vigna ratiata
Plant height reached 17 ± 3.7 cm in the treatment group containing 50 ppm GA spray. However, it reached 33.5 ± 6.1 cm and 40.1 ± 4.2 cm in the treatment group containing 100 and 150 ppm. Maximum plant height was measured as 44.5 ± 1.7 cm in 200 ppm spray. Moreover, at 250 ppm GA spray, plant height was not increased much compared with previous GA concentration (Fig. 4).
Fig. 4.
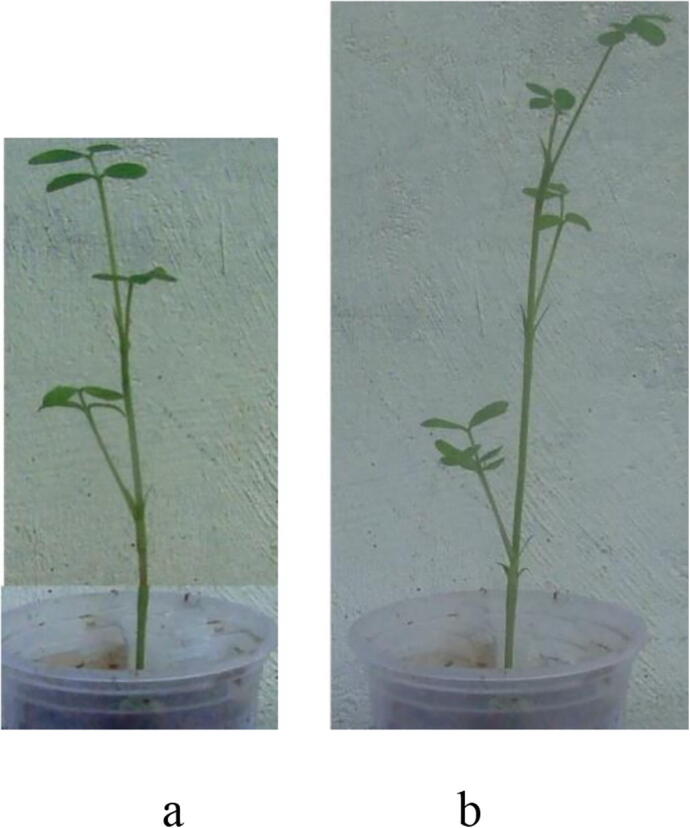
Growth of Mung bean plant treated with gibberellic acid from Paecilomyces sp. ZB (a) Plant treated with commercial gibberellic acid and (b) plant treated with Paecilomyces sp. ZB gibberellic acid.
4. Discussion
SSF is widely used for the production of gibberellic acid. In SSF, the solid wastes/agro industrial residues are frequently used for gibberellic acid production. Machado et al. (2002) applied coffee husk and cassava bagasse for gibberellic acid production by Gibberella fujikuroi and Fusarium moniliforme. Wheat gluten medium was applied for the production of gibberellic acid by Gibberella fujikuroi (Lale and Gadre, 2010). Cow dung substrate was earlier used for the production of various biomolecules (Vijayaraghavan et al., 2016); however, the production of gibberellic acid was not reported. Here for the first time, we report the use of cow dung for the production of gibberellic acid. This substrate was recognized as a cheap material and it was used as substrate for gibberellic acid production by Paecilomyces sp. ZB. In SSF, production of gibberellic acid ranges from a few µg to 8 mg / g of dry substrate (Rodrigues et al., 2016). In this study gibberellic acid production was 5.12 mg/g before optimization, which was maximum among the selected fungal isolates. Machado et al. (2000) screened gibberellic acid producing fungi and used coffee husk as the substrate and the achieved yield was 100 mg/kg.
In recent years, increased attention has been paid for the production of gibberellic acid using statistical approach. Rodrigues et al. (2009) employed the low-cost substrates, such as citric pulp, soy bran, soy husk, sugarcane bagasse, coffee husk, and cassava bagasse, for gibberellic acid production by Fusarium moniliforme using central composite rotatory design. Likewise, Isa and MatDon (2014) optimized the culture conditions for gibberellic acid production in SSF by Box-Behnken design, and the yield was 31.57 µg/g substrate. In our study the optimized medium showed 1312 µg/g, which was found to be good than certain fungal species. In comparison with other fungal species, Paecilomyces sp. ZB offers good options for gibberellic acid production, because it uses a cheap substrate for gibberellic acid production. The production of gibberellic acid by SSF allows the recycling of cow dung, with reduced production costs.
GA is one of the plant growth regulators which promoted plant growth in higher plants, but is also produced by bacteria and fungi (MacMillan, 2001). The initial step of GA biosynthesis pathways reported in fungi is almost similar with plants (Chanclud and Morel, 2016). It was previously reported that the application of GAs on the plants promote cell division (Arteca, 1996) and cell enlargement (Liu and Loy, 1976). These were applied on plants to enhance the growth and reported stimulated effect in Chinese cabbage, cucumber and crown daisy. In the present study, 200 ppm gibberellic acid spray concentration was maximum and enhanced plant growth (74.5 ± 6.7 cm). At higher GA concentration, plant growth suppressed. GA increased number of branches, plant height, number of leaves, leaf area, dry and fresh weights (Khan et al., 2010). In dwarf pea seeds, application of GA enhanced shoots growth stimulation and was reported (Baumgartner et al., 2008). In Faba Bean, the combination of 20 mM Ca+2 with 10−6 M GA3 increased shoot fresh weight, plant height, shoot dry weight, root fresh weight, root length, root number, root dry weight, water content, anthocyanin, chlorophyll and carbonic anhydrase activity (Al-Whaibi et al., 2010).
5. Conclusions
In conclusion, GA is a good plant growth regulator with numerous valued applications in agriculture sector. The industrial process presently used to produce GA is mainly based on submerged fermentation using Fusarium moniliforme or Gibberella fujikuroi. In this context, SSF fermentation technique has numerous advantages over submerged fermentation process for the production of metabolites and valorization of agro-wastes that can be used as cheap substrates.
Acknowledgements
The authors extend their appreciation to the Deanship of Scientific Research at King Saud University for funding this work through research group no. (RGP-1438-053).
Footnotes
Peer review under responsibility of King Saud University.
References
- Al-Whaibi M.H., Siddiqui M.H., Al-Amri A., Basalah M.O. Performance of faba bean under calcium and gibberellic acid application. Int. J. Plant Develop. Biol. 2010;1:60–63. [Google Scholar]
- Arteca R.N. Chapman and Hall Inc; New York: 1996. Plant Growth Substances: Principles and Applications. [Google Scholar]
- Baş D., Boyacı İ.H. Modeling and optimization I: Usability of response surface methodology. J. Food Eng. 2007;78:836–845. [Google Scholar]
- Baumgartner S., Shah D., Schaller J., Kämpfer U., Thurneysen A., Heusser P. Reproducibility of dwarf pea shoots growth stimulation by homeopathic potencies of gibberellic acid. Complemen. Therap. Med. 2008;16:183–191. doi: 10.1016/j.ctim.2008.03.001. [DOI] [PubMed] [Google Scholar]
- Ben Rhouma M., Kriaa M., Ben Nasr Y., Mellouli L., Kammoun R. A New Endophytic Fusarium Oxysporum Gibberellic Acid: Optimization of Production Using Combined Strategies of Experimental Designs and Potency on Tomato Growth under Stress Condition. BioMed Res. Int. 2020 doi: 10.1155/2020/4587148. 4587148. [DOI] [PMC free article] [PubMed] [Google Scholar]
- Camara M.C., Vandenberghe L.P., Rodrigues C., de Oliveira J., Faulds C., Bertrand E., Soccol C.R. Current advances in gibberellic acid (GA 3) production, patented technologies and potential applications. Planta. 2018;248(5):1049–1062. doi: 10.1007/s00425-018-2959-x. [DOI] [PubMed] [Google Scholar]
- Chanclud E., Morel J.B. Review Plant hormones: a fungal point of view. Mol. Plant Pathol. 2016;17(8):1289–1297. doi: 10.1111/mpp.12393. [DOI] [PMC free article] [PubMed] [Google Scholar]
- Chen H. Springer; Netherlands: 2013. Modern Solid State Fermentation. [Google Scholar]
- Cen Y.K., Lin J.G., Wang Y.L., Wang J.Y., Liu Z.Q., Zheng Y.G. The Gibberellin Producer Fusarium fujikuroi: Methods and Technologies in the Current Toolkit. Front. Bioeng. Biotechnol. 2020;8:232. doi: 10.3389/fbioe.2020.00232. [DOI] [PMC free article] [PubMed] [Google Scholar]
- Czitrom V. One-factor-at-a-time versus designed experiments. Amer. Stat. 1999;53:126–131. [Google Scholar]
- de Oliveira, J., Rodrigues, C., Vandenberghe, L.P., Câmara, M.C., Libardi, N., Soccol, C.R., 2017. Gibberellic acid production by different fermentation systems using citric pulp as substrate/support. BioMed Res. Int. 2017, Article ID 5191046, https://doi.org/10.1155/2017/5191046 [DOI] [PMC free article] [PubMed]
- Isa N.K., MatDon M. Investigation of the gibberellic acid optimization with a statistical tool from Penicillium variable in batch reactor. Prep. Biochem. Biotechnol. 2014;44:572–585. doi: 10.1080/10826068.2013.844707. [DOI] [PubMed] [Google Scholar]
- Karadeniz A., Topcuoğlu Ş.F., Inan S. Auxin, gibberellin, cytokinin and abscisic acid production in some bacteria. World J. Microbiol. Biotechnol. 2006;22:1061–1064. [Google Scholar]
- Khan M.N., Siddiqui M.H., Mohammad F., Naeem M., Khan M.M.A. Calcium chloride and gibberellic acid protect linseed (Linum usitatissimum L.) from NaCl stress by inducing antioxidative defence system and osmoprotectant accumulation. Acta. Physiologiae Plantarum. 2010;32:121–132. [Google Scholar]
- Lale G., Gadre R. Enhanced production of gibberellin A4 (GA4) by a mutant of Gibberella fujikuroi in wheat gluten medium. J. Ind. Microbiol. Biotechnol. 2010;37:297–306. doi: 10.1007/s10295-009-0673-1. [DOI] [PubMed] [Google Scholar]
- Liu P.B.W., Loy B. Action of gibberellic acid on cell proliferation in the subapical shoot meristem of watermelon seedlings. Am. J. Bot. 1976;63:700–704. [Google Scholar]
- Machado C.M., Soccol C.R., de Oliveira B.H. Gibberellic acid production by solid-state fermentation in coffee husk. Appl. Biochem. Biotechnol. 2002;102:179–191. doi: 10.1385/abab:102-103:1-6:179. [DOI] [PubMed] [Google Scholar]
- Machado C.M.M., Oliveira B.H., Pandey A. Springer, Netherlands; Coffee Biotechnol Coffee Agro-Industry, Londrina, Brazil Dordrecht: 2000. Coffee Husk as Substrate for the Production of Gibberellic Acid by Fermentation; pp. 401–408. [Google Scholar]
- MacMillan J. Occurrence of gibberellins in vascular plants, fungi, and bacteria. J Plant Growth Regul. 2001;20:387–442. doi: 10.1007/s003440010038. [DOI] [PubMed] [Google Scholar]
- Rejiniemon T.S., Raishy R., Hussain R., Rajamani B. In-vitro functional properties of Lactobacillus plantarum isolated from fermented ragi malt. South Ind. J. Biol. Sci. 2015;1:15–23. [Google Scholar]
- Robinson T., Singh D., Nigam P. Solid-state fermentation: a promising microbial technology for secondary metabolite production. Appl. Microbiol. Biotechnol. 2001;55:284–289. doi: 10.1007/s002530000565. [DOI] [PubMed] [Google Scholar]
- Rodrigues C., Vandenberghe L.P., de Oliveira J. New perspectives of gibberellic acid production: a review. Cri. Review Biotechnol. 2012;32:263–273. doi: 10.3109/07388551.2011.615297. [DOI] [PubMed] [Google Scholar]
- Rodrigues C., Vandenberghe L.P., Goyzueta L.D. Production, extraction and purifcation of gibberellic acid by solid state fermentation using citric pulp and soy husk. BAOJ Chemistry. 2016;2 [Google Scholar]
- Rodrigues C., Vandenberghe L.P., Teodoro J. A new alternative to produce gibberellic acid by solid state fermentation. Braz. Arch. Biol. Technol. 2009;52:181–188. [Google Scholar]
- Shivhare M., McCreath G. Practical considerations for DoE implementation in quality by design. BioProcess Int. 2010;8:22–30. [Google Scholar]
- Tsavkelova E.A. The biosynthesis of gibberellic acids by the transformants of orchid-associated Fusarium oxysporum. Mycol. Prog. 2016;15:1–8. [Google Scholar]
- Vijayaraghavan P., Vincent S.G., Dhillon G.S. Solid-substrate bioprocessing of cow dung for the production of carboxymethyl cellulase by Bacillus halodurans IND18. Waste Manage. 2016;48:513–520. doi: 10.1016/j.wasman.2015.10.004. [DOI] [PubMed] [Google Scholar]