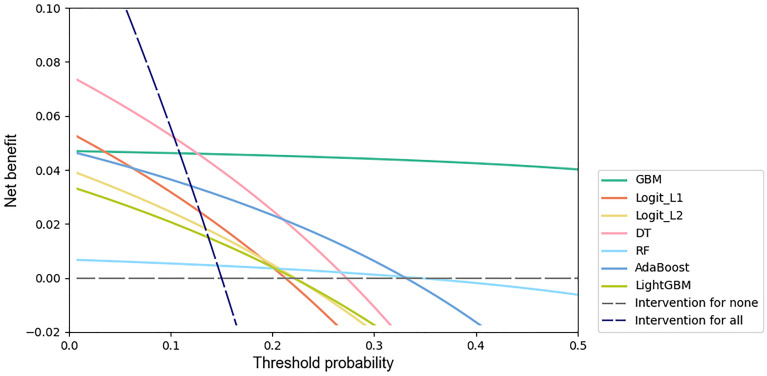
Fig 3. Decision curves for predicting IVIG resistance in KD patients by machine learning models.
The x-axis indicates the threshold probability for the outcome of IVIG resistance among KD patients without additional initial treatment. The y-axis indicates the net benefit. Two extreme strategies, intervention for all and intervention for none, were added as references.

