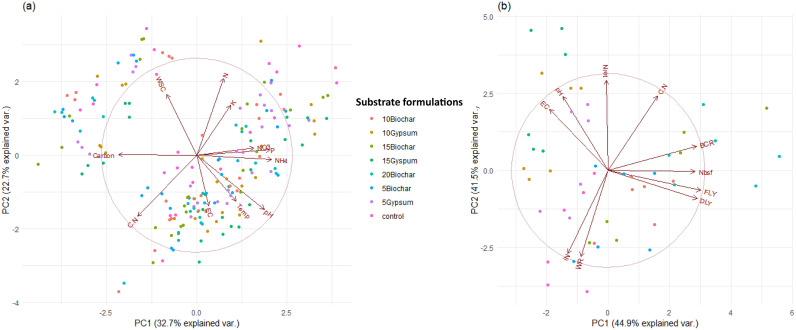
Fig 7. Bi-plot graphs based on PC analysis of parameters that measure frass fertilizer quality (a) and black soldier fly larval yields (b) as a function of the different biochar and gypsum amendments for nitrogen conservation in the rearing substrates.
Key: NO3 = nitrate nitrogen, NH4 ammonium nitrogen, N = total nitrogen, K = total potassium, P = total phosphorus, C:N = carbon to nitrogen ratio, EC = electrical conductivity, Temp = temperature, WSC = water soluble carbon, iN = initial nitrogen content in the rearing substrates, Nbsf = nitrogen accumulated in BSF larval biomass, Nret = nitrogen retained in the frass, WR = waste degradation, BCR = biomass conversion rate, FLY = wet BSF larval yield, DLY = dry BSF larval yield. 5Gypsum, 10Gypsum, 15Gypsum = substrate amended with 5, 10 and 15% gypsum, respectively, 5Biochar, 10Biochar, 15Biochar and 20Biochar = substrate amended with 5, 10, 15 and 20% biochar, respectively, control = unamended substrate.

